

GLOBAL ANTI-RHEUMATICS MARKET FORECAST 2020-2028
Global Anti-rheumatics Market by Type (Prescription-based Drugs, Over-the-counter Drugs) by Drug Class (Disease Modifying Anti-rheumatic Drugs, Nonsteroidal Anti-inflammatory Drugs, Corticosteroids, Uric Acid Drugs, Other Drug Class) and by Geography.
The global anti-rheumatics market is anticipated to grow at a CAGR of 2.32% between 2020 and 2028, and is anticipated to generate revenue of $72.27 billion by 2028. Rheumatoid arthritis (RA) is an autoimmune ailment, which causes swollen and painful joints in patients. The treatment of this medical condition involves the use of various drugs, known as anti-rheumatics.
The factors fueling the global anti-rheumatics market growth are:
- Rising geriatric population across the globe
- Increasing opportunities in the developing economies
- Surging prevalence of rheumatoid arthritis disease
- Growing healthcare expenditure across the globe
To learn more about this report, request a free sample copy
The important drivers increasing growth in the global anti-rheumatics market are the rising geriatric population across the globe and the surging prevalence of rheumatoid arthritis disease. The rapid growth of the geriatric population is one of the major drivers of the global anti-rheumatics market. The global geriatric population has increased significantly and is vulnerable to rheumatoid arthritis. Rheumatoid arthritis has become a major concern worldwide, as it is an autoimmune disease, which involves pain and inflammation of joints leading to limited mobility.
In 2019, disease modifying anti-rheumatic drugs was the dominating category in the drug class segment, contributing 36.91% of the revenue, and the nonsteroidal anti-inflammatory drugs category is estimated to be the fastest-growing drug class segment, registering CAGR of 3.09%. The disease-modifying anti-rheumatic (DMARDs) are used to modify the progression of rheumatoid arthritis. For instance, DMARDs can slow the progression of rheumatoid arthritis, which leads to the occurrence of fewer symptoms and lesser damage to joints over time. Nonsteroidal anti-inflammatory drugs are medications that belong to analgesics. These medicines reduce pain and fever, along with inflammation and hence, are employed in the management of rheumatoid arthritis
The patent expirations and lack of regulatory guidelines for biosimilars are the major factors hindering the global anti-rheumatics market growth. Patent expirations lead to the entry of low-priced generics in the market, which restricts its growth. The event is most likely to transform both, the competitive landscape and the RA treatment paradigm, during the forecast period. There will be the launch of biosimilars, but due to various regulatory guidelines, the availability of those products is delayed in those regions.
The report on the global anti-rheumatics market includes the segmentation analysis of the type and drug class.
Type is segmented into:
- Prescription-Based Drugs
- Over-the-Counter Drugs
Drug Class into is segmented:
- Disease-Modifying Anti-rheumatic Drugs
- Nonsteroidal Anti-inflammatory Drugs
- Corticosteroids
- Uric Acid Drugs
- Other Drug Class
Geographically, the global anti-rheumatics market has been segmented based on four major regions, which includes:
- North America: the United States and Canada
- Europe: Germany, the United Kingdom, France, Italy, Russia, Belgium, Poland, and the Rest of Europe
- Asia Pacific: India, China, South Korea, Japan, Thailand, Indonesia, Vietnam, Australia & New Zealand, and the Rest of Asia Pacific
- Rest of World: Latin America, the Middle East & Africa
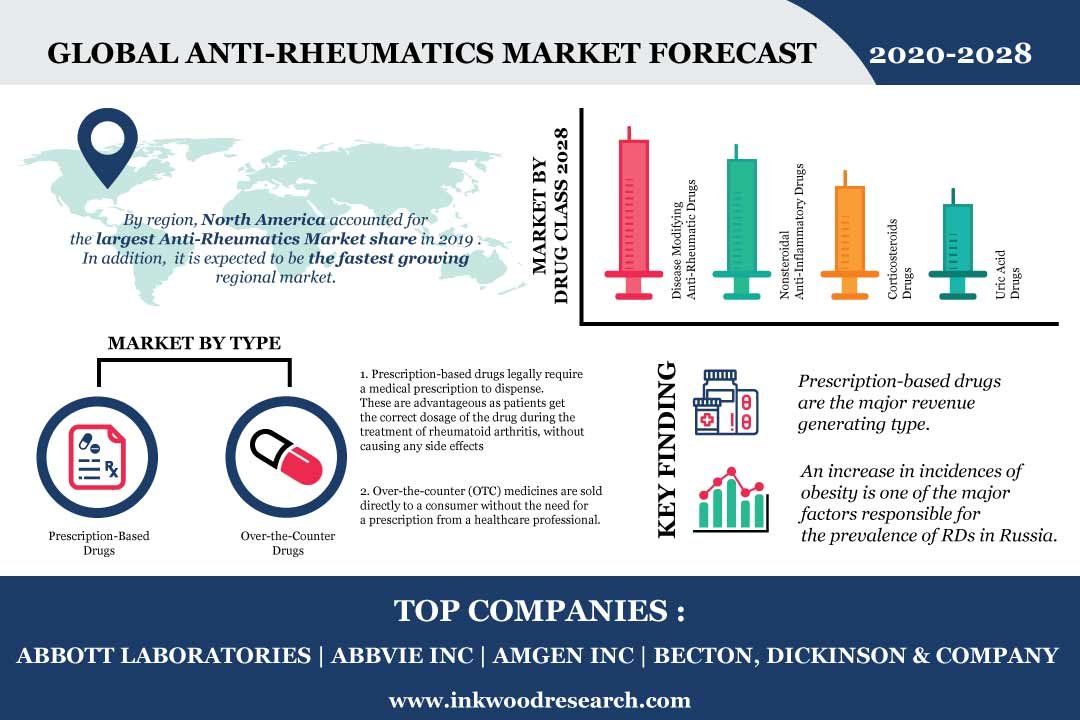
In 2019, North America captured the largest market share of approx. 40.94%, in terms of revenue, and is also anticipated to be the fastest-growing region, owing to a surge in the prevalence of rheumatoid arthritis. Moreover, an increase in the geriatric population is another major factor that fuels the growth of the anti-rheumatics market.
Some of the renowned market players of the global anti-rheumatics market are:
- AbbVie Inc
- Eli Lilly & company
- Pfizer Inc
- UCB
- Johnson & Johnson
- Others
Key strategies adopted by some of the anti-rheumatics companies are:
In July 2019, Abbott LatAm entered into a contract with BioGaia for the exclusive rights to sell BioGaia products under the BioGaia brand in Uruguay. Furthermore, in July 2019, Merck and Skyhawk Therapeutics entered into an agreement to develop small molecules that modulate RNA splicing. In January 2020, UCB announced that it had received an agreement from the Japanese health establishments for CIMZIA (certolizumab pegol) to treat psoriatic arthritis, plaque psoriasis, psoriatic erythroderma and pustular psoriasis for which existing treatment methods are not sufficiently effective.
Key findings of the global anti-rheumatics market are:
- Prescription-based drugs are the major revenue generating type.
- Nonsteroidal anti-inflammatory drugs are the fastest-growing drug class segment.
- Constant inflammation and bone loss can also lead to osteoporosis and bone fractures leading to rheumatoid arthritis (RA).
- Overexpression of tumor necrosis factor (TNF) is one of the key mediators in the pathogenesis of RA.
- Quality of life (QOL) is an important consideration for people with RA.
- An increase in incidences of obesity is one of the major factors responsible for the prevalence of RDs in Russia.
- RESEARCH SCOPE & METHODOLOGY
- STUDY OBJECTIVES
- SCOPE OF STUDY
- METHODOLOGY
- ASSUMPTIONS & LIMITATIONS
- EXECUTIVE SUMMARY
- MARKET SIZE & ESTIMATES
- MARKET OVERVIEW
- MARKET DYNAMICS
- MARKET DEFINITION
- KEY DRIVERS
- RISING GERIATRIC POPULATION ACROSS THE GLOBE
- INCREASING OPPORTUNITIES IN THE DEVELOPING ECONOMIES
- SURGE IN THE PREVALENCE OF RHEUMATOID ARTHRITIS DISEASE
- GROWING HEALTHCARE EXPENDITURE ACROSS THE GLOBE
- KEY RESTRAINTS
- PATENT EXPIRATIONS
- LACK OF REGULATORY GUIDELINES FOR BIOSIMILARS WILL DELAY THEIR AVAILABILITY IN SOME REGIONS
- LESS EXPENSIVE ALTERNATIVES
- KEY ANALYTICS
- PORTER’S FIVE FORCE ANALYSIS
- THREAT OF NEW ENTRY
- THREAT OF SUBSTITUTION
- BUYER’S POWER
- SUPPLIER’S POWER
- COMPETITIVE RIVALRY
- ETIOLOGY OF RHEUMATOID ARTHRITIS (RA)
- SYMPTOMS OF RHEUMATOID ARTHRITIS
- RISK FACTORS ASSOCIATED WITH RHEUMATOID ARTHRITIS
- OPPORTUNITY MATRIX
- VENDOR LANDSCAPE
- KEY INVESTMENT INSIGHTS
- PORTER’S FIVE FORCE ANALYSIS
- MARKET BY TYPE
- PRESCRIPTION-BASED DRUGS
- OVER-THE-COUNTER DRUGS
- MARKET BY DRUG CLASS
- DISEASE MODIFYING ANTI-RHEUMATIC DRUGS
- NONSTEROIDAL ANTI-INFLAMMATORY DRUGS
- CORTICOSTEROIDS
- URIC ACID DRUGS
- OTHER DRUG CLASS
- GEOGRAPHICAL ANALYSIS
- NORTH AMERICA
- THE UNITED STATES
- CANADA
- EUROPE
- THE UNITED KINGDOM
- FRANCE
- GERMANY
- ITALY
- RUSSIA
- BELGIUM
- POLAND
- REST OF EUROPE
- ASIA PACIFIC
- CHINA
- JAPAN
- INDIA
- AUSTRALIA & NEW ZEALAND
- SOUTH KOREA
- THAILAND
- INDONESIA
- VIETNAM
- REST OF ASIA PACIFIC
- REST OF WORLD
- LATIN AMERICA
- MIDDLE EAST & AFRICA
- NORTH AMERICA
- COMPANY PROFILES
- ABBOTT LABORATORIES
- ABBVIE INC
- AMGEN INC
- BECTON, DICKINSON & COMPANY (BD)
- BIO-RAD LABORATORIES INC
- BRISTOL-MYERS SQUIBB COMPANY
- ELI LILLY & COMPANY
- LUPIN LIMITED
- HOFFMANN-LA ROCHE
- JOHNSON & JOHNSON
- MERCK & CO INC
- NOVARTIS AG
- PERKINELMER
- PFIZER INC
- UCB
TABLE LIST
TABLE 1: MARKET SNAPSHOT – ANTI-RHEUMATICS
TABLE 2: COMMON SYMPTOMS OF RHEUMATOID ARTHRITIS
TABLE 3: RISK FACTORS FOR RHEUMATOID ARTHRITIS
TABLE 4: GLOBAL ANTI-RHEUMATICS MARKET, BY TYPE, HISTORICAL YEARS, 2016-2019 (IN $ MILLION)
TABLE 5: GLOBAL ANTI-RHEUMATICS MARKET, BY TYPE, FORECAST YEARS, 2020-2028 (IN $ MILLION)
TABLE 6: GLOBAL PRESCRIPTION-BASED DRUGS MARKET, BY REGION, HISTORICAL YEARS, 2016-2019 (IN $ MILLION)
TABLE 7: GLOBAL PRESCRIPTION-BASED DRUGS MARKET, BY REGION, FORECAST YEARS, 2020-2028 (IN $ MILLION)
TABLE 8: GLOBAL OVER-THE-COUNTER DRUGS MARKET, BY REGION, HISTORICAL YEARS, 2016-2019 (IN $ MILLION)
TABLE 9: GLOBAL OVER-THE-COUNTER DRUGS MARKET, BY REGION, FORECAST YEARS, 2020-2028 (IN $ MILLION)
TABLE 10: GLOBAL ANTI-RHEUMATICS MARKET, BY DRUG CLASS, HISTORICAL YEARS, 2016-2019 (IN $ MILLION)
TABLE 11: GLOBAL ANTI-RHEUMATICS MARKET, BY DRUG CLASS, FORECAST YEARS, 2020-2028 (IN $ MILLION)
TABLE 12: GLOBAL DISEASE MODIFYING ANTI-RHEUMATIC DRUGS MARKET, BY REGION, HISTORICAL YEARS, 2016-2019 (IN $ MILLION)
TABLE 13: GLOBAL DISEASE MODIFYING ANTI-RHEUMATIC DRUGS MARKET, BY REGION, FORECAST YEARS, 2020-2028 (IN $ MILLION)
TABLE 14: GLOBAL NONSTEROIDAL ANTI-INFLAMMATORY DRUGS MARKET, BY REGION, HISTORICAL YEARS, 2016-2019 (IN $ MILLION)
TABLE 15: GLOBAL NONSTEROIDAL ANTI-INFLAMMATORY DRUGS MARKET, BY REGION, FORECAST YEARS, 2020-2028 (IN $ MILLION)
TABLE 16: GLOBAL CORTICOSTEROIDS MARKET, BY REGION, HISTORICAL YEARS, 2016-2019 (IN $ MILLION)
TABLE 17: GLOBAL CORTICOSTEROIDS MARKET, BY REGION, FORECAST YEARS, 2020-2028 (IN $ MILLION)
TABLE 18: GLOBAL URIC ACID DRUGS MARKET, BY REGION, HISTORICAL YEARS, 2016-2019 (IN $ MILLION)
TABLE 19: GLOBAL URIC ACID DRUGS MARKET, BY REGION, FORECAST YEARS, 2020-2028 (IN $ MILLION)
TABLE 20: GLOBAL OTHER DRUG CLASS MARKET, BY REGION, HISTORICAL YEARS, 2016-2019 (IN $ MILLION)
TABLE 21: GLOBAL OTHER DRUG CLASS MARKET, BY REGION, FORECAST YEARS, 2020-2028 (IN $ MILLION)
TABLE 22: GLOBAL ANTI-RHEUMATICS MARKET, BY REGION, HISTORICAL YEARS, 2016-2019 (IN $ MILLION)
TABLE 23: GLOBAL ANTI-RHEUMATICS MARKET, BY REGION MARKET, FORECAST YEARS, 2020-2028 (IN $ MILLION)
TABLE 24: NORTH AMERICA ANTI-RHEUMATICS MARKET, BY COUNTRY, HISTORICAL YEARS, 2016-2019 (IN $ MILLION)
TABLE 25: NORTH AMERICA ANTI-RHEUMATICS MARKET, BY COUNTRY, FORECAST YEAR 2020-2028 (IN $ MILLION)
TABLE 26: EUROPE ANTI-RHEUMATICS MARKET, BY COUNTRY, HISTORICAL YEARS, 2016-2019 (IN $ MILLION)
TABLE 27: EUROPE ANTI-RHEUMATICS, BY COUNTRY, FORECAST YEARS, 2020-2028 (IN $ MILLION)
TABLE 28: ASIA PACIFIC ANTI-RHEUMATICS MARKET, BY COUNTRY, HISTORICAL YEARS, 2016-2019 (IN $ MILLION)
TABLE 29: ASIA PACIFIC ANTI-RHEUMATICS MARKET, BY COUNTRY, FORECAST YEARS, 2020-2028 (IN $ MILLION)
TABLE 30: REST OF WORLD ANTI-RHEUMATICS MARKET, BY REGION, HISTORICAL YEARS, 2016-2019 (IN $ MILLION)
TABLE 31: REST OF WORLD ANTI-RHEUMATICS MARKET, BY REGION, FORECAST YEARS, 2020-2028 (IN $ MILLION)
FIGURE LIST
FIGURE 1: PORTER’S FIVE FORCE ANALYSIS
FIGURE 2: OPPORTUNITY MATRIX
FIGURE 3: VENDOR LANDSCAPE
FIGURE 4: KEY INVESTMENT INSIGHTS
FIGURE 5: GLOBAL ANTI-RHEUMATICS MARKET, BY TYPE, IN 2019
FIGURE 6: GLOBAL ANTI-RHEUMATICS MARKET, BY PRESCRIPTION-BASED DRUGS, 2020-2028 (IN $ MILLION)
FIGURE 7: GLOBAL ANTI-RHEUMATICS MARKET, BY OVER-THE-COUNTER DRUGS, 2020-2028 (IN $ MILLION)
FIGURE 8: GLOBAL ANTI-RHEUMATICS MARKET, BY DRUG CLASS, IN 2019
FIGURE 9: GLOBAL ANTI-RHEUMATICS MARKET, BY DISEASE MODIFYING ANTI-RHEUMATIC DRUGS, 2020-2028 (IN $ MILLION)
FIGURE 10: GLOBAL ANTI-RHEUMATICS MARKET, BY NONSTEROIDAL ANTI-INFLAMMATORY DRUGS, 2020-2028 (IN $ MILLION)
FIGURE 11: GLOBAL ANTI-RHEUMATICS MARKET, BY CORTICOSTEROIDS, 2020-2028 (IN $ MILLION)
FIGURE 12: GLOBAL ANTI-RHEUMATICS MARKET, BY URIC ACID DRUGS, 2020-2028 (IN $ MILLION)
FIGURE 13: GLOBAL ANTI-RHEUMATICS MARKET, BY OTHER DRUG CLASS, 2020-2028 (IN $ MILLION)
FIGURE 14: NORTH AMERICA ANTI-RHEUMATICS MARKET, COUNTRY OUTLOOK, 2019 & 2028 (IN %)
FIGURE 15: THE UNITED STATES ANTI-RHEUMATICS MARKET, 2020-2028 (IN $ MILLION)
FIGURE 16: CANADA ANTI-RHEUMATICS MARKET, 2020-2028 (IN $ MILLION)
FIGURE 17: EUROPE ANTI-RHEUMATICS MARKET, COUNTRY OUTLOOK, 2019 & 2028 (IN %)
FIGURE 18: THE UNITED KINGDOM ANTI-RHEUMATICS MARKET, 2020-2028 (IN $ MILLION)
FIGURE 19: FRANCE ANTI-RHEUMATICS MARKET, 2020-2028 (IN $ MILLION)
FIGURE 20: GERMANY ANTI-RHEUMATICS MARKET, 2020-2028 (IN $ MILLION)
FIGURE 21: ITALY ANTI-RHEUMATICS MARKET, 2020-2028 (IN $ MILLION)
FIGURE 22: RUSSIA ANTI-RHEUMATICS MARKET, 2020-2028 (IN $ MILLION)
FIGURE 23: BELGIUM ANTI-RHEUMATICS MARKET, 2020-2028 (IN $ MILLION)
FIGURE 24: POLAND ANTI-RHEUMATICS MARKET, 2020-2028 (IN $ MILLION)
FIGURE 25: REST OF EUROPE ANTI-RHEUMATICS MARKET, 2020-2028 (IN $ MILLION)
FIGURE 26: ASIA PACIFIC ANTI-RHEUMATICS MARKET, COUNTRY OUTLOOK, 2019 & 2028 (IN %)
FIGURE 27: CHINA ANTI-RHEUMATICS MARKET, 2020-2028 (IN $ MILLION)
FIGURE 28: JAPAN ANTI-RHEUMATICS MARKET, 2020-2028 (IN $ MILLION)
FIGURE 29: INDIA ANTI-RHEUMATICS MARKET, 2020-2028 (IN $ MILLION)
FIGURE 30: AUSTRALIA & NEW ZEALAND ANTI-RHEUMATICS MARKET, 2020-2028 (IN $ MILLION)
FIGURE 31: SOUTH KOREA ANTI-RHEUMATICS MARKET, 2020-2028 (IN $ MILLION)
FIGURE 32: THAILAND ANTI-RHEUMATICS MARKET, 2020-2028 (IN $ MILLION)
FIGURE 33: INDONESIA ANTI-RHEUMATICS MARKET, 2020-2028 (IN $ MILLION)
FIGURE 34: VIETNAM ANTI-RHEUMATICS MARKET, 2020-2028 (IN $ MILLION)
FIGURE 35: REST OF ASIA PACIFIC ANTI-RHEUMATICS MARKET, 2020-2028 (IN $ MILLION)
FIGURE 36: REST OF WORLD ANTI-RHEUMATICS MARKET, REGIONAL OUTLOOK, 2019 & 2028 (IN %)
FIGURE 37: LATIN AMERICA ANTI-RHEUMATICS MARKET, 2020-2028 (IN $ MILLION)
FIGURE 38: MIDDLE EAST & AFRICA ANTI-RHEUMATICS MARKET, 2020-2028 (IN $ MILLION)
- MARKET BY TYPE
- PRESCRIPTION-BASED DRUGS
- OVER-THE-COUNTER DRUGS
- MARKET BY DRUG CLASS
- DISEASE MODIFYING ANTI-RHEUMATIC DRUGS
- NONSTEROIDAL ANTI-INFLAMMATORY DRUGS
- CORTICOSTEROIDS
- URIC ACID DRUGS
- OTHER DRUG CLASS
- GEOGRAPHICAL ANALYSIS
- NORTH AMERICA
- THE UNITED STATES
- CANADA
- EUROPE
- THE UNITED KINGDOM
- FRANCE
- GERMANY
- ITALY
- RUSSIA
- BELGIUM
- POLAND
- REST OF EUROPE
- ASIA PACIFIC
- CHINA
- JAPAN
- INDIA
- AUSTRALIA & NEW ZEALAND
- SOUTH KOREA
- THAILAND
- INDONESIA
- VIETNAM
- REST OF ASIA PACIFIC
- REST OF WORLD
- LATIN AMERICA
- MIDDLE EAST & AFRICA
- NORTH AMERICA
To request a free sample copy of this report, please complete the form below :
We offer 10% free customization including country-level data, niche applications and competitive landscape with every report.
Choose License Type
RELATED REPORTS
-

GLOBAL HALAL PHARMACEUTICALS MARKET FORECAST 2025-2032
-

ASIA-PACIFIC HALAL PHARMACEUTICALS MARKET FORECAST 2025-2032
-

EUROPE HALAL PHARMACEUTICALS MARKET FORECAST 2025-2032
-

NORTH AMERICA HALAL PHARMACEUTICALS MARKET FORECAST 2025-2032
-

LATIN AMERICA HALAL PHARMACEUTICALS MARKET FORECAST 2025-2032
-

MIDDLE EAST & AFRICA HALAL PHARMACEUTICALS MARKET FORECAST 2025-2032
-

EGYPT HALAL PHARMACEUTICALS MARKET FORECAST 2025-2032
-

MALAYSIA HALAL PHARMACEUTICALS MARKET FORECAST 2025-2032
-

INDONESIA HALAL PHARMACEUTICALS MARKET FORECAST 2025-2032
-

GLOBAL HALAL NUTRACEUTICALS MARKET FORECAST 2025-2032