GLOBAL AGRICULTURE TECHNOLOGY AS A SERVICE MARKET FORECAST 2023-2032
SCOPE OF THE REPORT
Global Agriculture Technology as a Service Market by Technology (Data Analytics & Intelligence, Guidance Technology, Sensing Technology, Variable Rate Application Technology, Other Technologies) Market by Type (Software as a Service, Equipment as a Service) Market by Application (Yield Mapping and Monitoring, Soil Management, Crop Health Management, Navigation and Positioning, Other Applications) by Geography
REPORTS » AGRICULTURE » AGRICULTURAL EQUIPMENT » GLOBAL AGRICULTURE TECHNOLOGY AS A SERVICE MARKET FORECAST 2023-2032
MARKET OVERVIEW
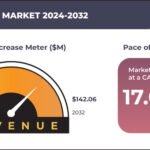
The global Agriculture Technology as a Service market was valued at $1498.52 million in 2022 and is expected to reach $7415.11 million by 2032, growing at a CAGR of 17.37% during the forecast years 2023 and 2032. The market study has also analyzed the impact of COVID-19 on the global Agriculture Technology as a Service market qualitatively as well as quantitatively.
Agriculture Technology as a Service (ATaaS) is a modern approach to farming that leverages advanced technology solutions to optimize various aspects of agricultural operations. It involves the provision of agricultural technology and services on a subscription or pay-per-use basis, allowing farmers to access cutting-edge tools and expertise without the need for significant upfront investments.
ATaaS typically encompasses a wide range of services, including precision farming, data analytics, drone surveillance, IoT-based monitoring, and crop management software. This model enables farmers to make data-driven decisions, increase productivity, reduce resource wastage, and ultimately enhance their overall farming efficiency, making it a valuable solution for modernizing and improving the sustainability of agriculture.
The flexible business model empowers customers to access their preferred agricultural technology, including equipment or software, through various affordable pricing structures, as opposed to making a single upfront purchase. Among the most widely adopted pricing models within ATaaS are the pay-per-use (PPU) and subscription models.

Read our latest blog on the Agriculture Technology as a Service Market
GROWTH ENABLERS
Key enablers of the global Agriculture Technology as a Service market growth:
- Innovation and technological advancements in agricultural technology
- Need for minimal capital investment
- With the ATaaS business model, customers don’t need to purchase the complete integrated agriculture technology solution; companies offer the flexibility of leasing their agricultural technology equipment, utilize services as per their requirement and make payment for the same as per usage.
- Moreover, the combination of cost affordability, feasibility, and accessibility, coupled with active customer engagement initiatives by companies, places customers in a favorable position within the ATaaS business model. These factors contribute to the success of companies that price their agricultural technologies and related equipment in a model that enables customers to invest low capital investment. Moreover, it also helps generate a customer base of small and middle-income farmers along with high-income farmers.
- Economic necessity of precision agriculture
- Increased demand for global food production
GROWTH RESTRAINTS
Key growth restraining factors of the global Agriculture Technology as a Service market:
- Lack of technical expertise among farmers
- Poor connectivity impacting technological services
- A notable challenge faced by the Agriculture Technology as a Service market, particularly in remote and rural farming areas, is the absence of robust connectivity. In this context, connectivity pertains to the availability of dependable, high-speed internet access, which plays a pivotal role in ensuring the seamless operation and efficacy of cutting-edge agricultural technologies.
To Know More About This Report, Request a Free Sample Copy
KEY MARKET TRENDS
Global Agriculture Technology as a Service Market | Top Trends
- Artificial Intelligence and machine learning enable precision agriculture, where data from various sources like sensors, drones, and satellites are collected and analyzed to make informed decisions. Algorithms can assess factors like soil quality, weather conditions, and crop health to optimize planting, irrigation, and harvesting. This technology minimizes resource wastage by precisely delivering water, fertilizers, and pesticides, resulting in higher yields and reduced environmental impact. In addition, AI-driven image recognition and computer vision systems can help identify crop diseases, pests, and nutrient deficiencies by analyzing images captured by drones or cameras. Farmers receive real-time alerts and recommendations to take corrective actions, thereby increasing crop productivity and reducing losses.
- Vertical farming represents a groundbreaking method for cultivating crops in vertically stacked layers, be it within skyscrapers, repurposed warehouses, or shipping containers. This innovative approach enables the production of abundant quantities of nutritious, high-quality fresh produce while circumventing the reliance on favorable weather conditions, excessive water consumption, a surplus of skilled labor, and exceptionally fertile soil. Consequently, there has been a discernible upsurge in demand for vertical farming, driven by factors like the optimized utilization of vertical spaces, judicious energy consumption, and the burgeoning urban population’s call for organic sustenance.
- The burgeoning adoption of technology-driven vertical farming practices in developing nations is poised to offer an enticing opportunity to the market. This development is particularly significant in light of the mounting population, which intensifies the gap between food supply and demand, underscoring the necessity for alternative farming methods such as vertical farming.
MARKET SEGMENTATION
Market Segmentation – Type, Technology, and Application –
Market by Type:
- Software as a Service (SaaS)
- Software as a Service (SaaS) is the largest revenue-generating type in the global Agriculture Technology as a Service market.
- SaaS allows companies to offer their products at lower prices than the conventional model of a one-time purchase. Maintenance costs are reduced for the consumers since the companies own the environment, and the cost is split among all other customers.
- These lower-cost models allow the agriculture companies to expand their customer base into low- and medium-income farmers as well. Since the software is installed and configured in the host company’s environment and cloud, the integration and deployment time is reduced, leading to ease amongst both parties.
- Equipment as a Service (EaaS)
Market by Technology:
- Data Analytics & Intelligence
- Guidance Technology
- Sensing Technology
- Variable Rate Application Technology
- Variable rate application technology is the fastest-growing technology in the global Agriculture Technology as a Service market.
- Variable rate application (VRA) is the method of utilization of agricultural inputs at varying rates in proper zones throughout a field. This method is applied to ensure efficiencies in input application in the fields, along with ensuring effectiveness, sustainability, and environmental safety.
- Through this component, the user can focus on the area that provides a maximum return. Besides, variable rate application technology services are conducted in a one-stage approach or a two-stage approach.
- Other Technologies
Market by Application:
- Yield Mapping and Monitoring
- Soil Management
- Crop Health Management
- Navigation and Positioning
- Other Applications
GEOGRAPHICAL STUDY
Geographical Study based on Four Major Regions:- North America: The United States and Canada
- North America is set to be the dominating region in the global Agriculture Technology as a Service market.
- The continuous growth in hybrid crop production and the ongoing technological advancements in agriculture present substantial opportunities for market expansion. Moreover, the growth of the Agriculture Technology as a Service market in North America is attributed to the prevailing trends favoring the adoption of IoT systems and advanced farming equipment.
- The presence of industry leaders such as Deere and Company, AGCO, and Trimble Inc in the agricultural equipment sector has played a pivotal role in driving the development of diverse digital technologies and offering comprehensive solutions for precision agriculture.
- Furthermore, the widespread adoption of digital technologies among farms has significantly accelerated the uptake of precision agriculture and Agriculture Technology as a Service (ATaaS) market across the entire North American region.
- Europe: The United Kingdom, Germany, France, Italy, Spain, the Netherlands, and Rest of Europe
- Asia Pacific: China, Japan, India, South Korea, Thailand, Indonesia, Australia & New Zealand, and Rest of Asia-Pacific
- Rest of World: Latin America, the Middle East & Africa
MAJOR PLAYERS
Major players in the global Agriculture Technology as a Service market:
- Agco Corporation
- Deere and Company
- Trimble Inc
- Raven Industries
- Fujitsu
- Topcon Corporation
- CLAAS
Key strategies adopted by some of these companies:
- In July 2023, John Deere and Cargill announced a partnership to enhance the in-field and digital experience for farmers using John Deere technology within the Cargill RegenConnect® program. This collaboration promotes regenerative agriculture practices, boosts soil health, and reduces the carbon footprint by offering financial incentives to farmers. John Deere’s Operations Center, a precision technology and digital platform, aids farmers in implementing and documenting these practices.
- In May 2022, AGCO Corp acquired JCA Industries Inc (an autonomous software provider of agricultural-related products) to enhance the company’s machine automation and automation system portfolio.
REPORT SYNOPSIS
| REPORT SCOPE | DETAILS |
|---|---|
| Market Forecast Years | 2023-2032 |
| Base Year | 2022 |
| Market Historical Years | 2018-2022 |
| Forecast Units | Revenue ($ Million) |
| Segments Analyzed | Type, Technology, and Application |
| Geographies Analyzed | North America, Europe, Asia-Pacific, and Rest of World |
| Companies Analyzed | Accenture, Agco Corporation, Agrivi Ltd, Airbus SAS, AT&T, Ceres Imaging, CLAAS KGaA mbH, Deere & Company, Fujitsu, Hexagon AB, IBM Corporation, Microsoft Corporation, Raven |
TABLE OF CONTENT
RESEARCH SCOPE & METHODOLOGY
- STUDY OBJECTIVES
- METHODOLOGY
- ASSUMPTIONS & LIMITATIONS
EXECUTIVE SUMMARY
- MARKET SIZE & ESTIMATES
- MARKET OVERVIEW
- SCOPE OF STUDY
- CRISIS SCENARIO ANALYSIS
- MAJOR MARKET FINDINGS
- AUTOMATION IS BECOMING AN INTEGRAL PART OF THE AGRICULTURAL SECTOR
- RISE OF CORPORATE FARMING GLOBALLY
- CONCERNS REGARDING DATA PRIVACY AND DATA OWNERSHIP
MARKET DYNAMICS
- KEY DRIVERS
- INCREASED DEMAND FOR GLOBAL FOOD PRODUCTION
- ECONOMIC NECESSITY OF PRECISION AGRICULTURE
- NEED FOR MINIMAL CAPITAL INVESTMENT
- INNOVATION AND TECHNOLOGICAL ADVANCEMENTS IN AGRICULTURE
- KEY RESTRAINTS
- LACK OF TECHNICAL EXPERTISE AMONG FARMERS
- POOR CONNECTIVITY IMPACTS TECHNOLOGICAL SERVICES
- KEY DRIVERS
KEY ANALYTICS
- KEY MARKET TRENDS
- PORTER’S FIVE FORCES ANALYSIS
- BUYERS POWER
- SUPPLIERS POWER
- SUBSTITUTION
- NEW ENTRANTS
- INDUSTRY RIVALRY
- GROWTH PROSPECT MAPPING
- MARKET MATURITY ANALYSIS
- MARKET CONCENTRATION ANALYSIS
- KEY BUYING CRITERIA
- DATA ANALYSIS
- CONNECTIVITY
- DATA SECURITY
- DATA COLLECTION FREQUENCY
MARKET BY TECHNOLOGY
- DATA ANALYTICS & INTELLIGENCE
- GUIDANCE TECHNOLOGY
- SENSING TECHNOLOGY
- VARIABLE RATE APPLICATION TECHNOLOGY
- OTHER TECHNOLOGIES
MARKET BY TYPE
- SOFTWARE AS A SERVICE (SAAS)
- EQUIPMENT AS A SERVICE (EAAS)
MARKET BY APPLICATION
- YIELD MAPPING AND MONITORING
- SOIL MANAGEMENT
- CROP HEALTH MANAGEMENT
- NAVIGATION AND POSITIONING
- OTHER APPLICATIONS
GEOGRAPHICAL ANALYSIS
- NORTH AMERICA
- MARKET SIZE & ESTIMATES
- NORTH AMERICA AGRICULTURE TECHNOLOGY AS A SERVICE MARKET DRIVERS
- NORTH AMERICA AGRICULTURE TECHNOLOGY AS A SERVICE MARKET CHALLENGES
- KEY PLAYERS IN NORTH AMERICA AGRICULTURE TECHNOLOGY AS A SERVICE MARKET
- COUNTRY ANALYSIS
- UNITED STATES
- UNITED STATES AGRICULTURE TECHNOLOGY AS A SERVICE MARKET SIZE & OPPORTUNITIES
- CANADA
- CANADA AGRICULTURE TECHNOLOGY AS A SERVICE MARKET SIZE & OPPORTUNITIES
- UNITED STATES
- EUROPE
- MARKET SIZE & ESTIMATES
- EUROPE AGRICULTURE TECHNOLOGY AS A SERVICE MARKET DRIVERS
- EUROPE AGRICULTURE TECHNOLOGY AS A SERVICE MARKET CHALLENGES
- KEY PLAYERS IN EUROPE AGRICULTURE TECHNOLOGY AS A SERVICE MARKET
- COUNTRY ANALYSIS
- UNITED KINGDOM
- UNITED KINGDOM AGRICULTURE TECHNOLOGY AS A SERVICE MARKET SIZE & OPPORTUNITIES
- GERMANY
- GERMANY AGRICULTURE TECHNOLOGY AS A SERVICE MARKET SIZE & OPPORTUNITIES
- FRANCE
- FRANCE AGRICULTURE TECHNOLOGY AS A SERVICE MARKET SIZE & OPPORTUNITIES
- ITALY
- ITALY AGRICULTURE TECHNOLOGY AS A SERVICE MARKET SIZE & OPPORTUNITIES
- SPAIN
- SPAIN AGRICULTURE TECHNOLOGY AS A SERVICE MARKET SIZE & OPPORTUNITIES
- NETHERLANDS
- NETHERLANDS AGRICULTURE TECHNOLOGY AS A SERVICE MARKET SIZE & OPPORTUNITIES
- REST OF EUROPE
- REST OF EUROPE AGRICULTURE TECHNOLOGY AS A SERVICE MARKET SIZE & OPPORTUNITIES
- UNITED KINGDOM
- ASIA-PACIFIC
- MARKET SIZE & ESTIMATES
- ASIA-PACIFIC AGRICULTURE TECHNOLOGY AS A SERVICE MARKET DRIVERS
- ASIA-PACIFIC AGRICULTURE TECHNOLOGY AS A SERVICE MARKET CHALLENGES
- KEY PLAYERS IN ASIA-PACIFIC AGRICULTURE TECHNOLOGY AS A SERVICE MARKET
- COUNTRY ANALYSIS
- CHINA
- CHINA AGRICULTURE TECHNOLOGY AS A SERVICE MARKET SIZE & OPPORTUNITIES
- JAPAN
- JAPAN AGRICULTURE TECHNOLOGY AS A SERVICE MARKET SIZE & OPPORTUNITIES
- INDIA
- INDIA AGRICULTURE TECHNOLOGY AS A SERVICE MARKET SIZE & OPPORTUNITIES
- SOUTH KOREA
- SOUTH KOREA AGRICULTURE TECHNOLOGY AS A SERVICE MARKET SIZE & OPPORTUNITIES
- THAILAND
- THAILAND AGRICULTURE TECHNOLOGY AS A SERVICE MARKET SIZE & OPPORTUNITIES
- INDONESIA
- INDONESIA AGRICULTURE TECHNOLOGY AS A SERVICE MARKET SIZE & OPPORTUNITIES
- AUSTRALIA & NEW ZEALAND
- AUSTRALIA & NEW ZEALAND AGRICULTURE TECHNOLOGY AS A SERVICE MARKET SIZE & OPPORTUNITIES
- REST OF ASIA-PACIFIC
- REST OF ASIA-PACIFIC AGRICULTURE TECHNOLOGY AS A SERVICE MARKET SIZE & OPPORTUNITIES
- CHINA
- REST OF WORLD
- MARKET SIZE & ESTIMATES
- REST OF WORLD AGRICULTURE TECHNOLOGY AS A SERVICE MARKET DRIVERS
- REST OF WORLD AGRICULTURE TECHNOLOGY AS A SERVICE MARKET CHALLENGES
- KEY PLAYERS IN REST OF WORLD AGRICULTURE TECHNOLOGY AS A SERVICE MARKET
- REGIONAL ANALYSIS
- LATIN AMERICA
- LATIN AMERICA AGRICULTURE TECHNOLOGY AS A SERVICE MARKET SIZE & OPPORTUNITIES
- MIDDLE EAST & AFRICA
- MIDDLE EAST & AFRICA AGRICULTURE TECHNOLOGY AS A SERVICE MARKET SIZE & OPPORTUNITIES
- LATIN AMERICA
- NORTH AMERICA
COMPETITIVE LANDSCAPE
- KEY STRATEGIC DEVELOPMENTS
- PRODUCT LAUNCHES & DEVELOPMENTS
- PARTNERSHIPS AND AGREEMENTS
- BUSINESS EXPANSIONS & DIVESTITURES
- COMPANY PROFILES
- ACCENTURE
- COMPANY OVERVIEW
- PRODUCTS / SERVICES LIST
- STRENGTHS & CHALLENGES
- AGCO CORPORATION
- COMPANY OVERVIEW
- PRODUCTS / SERVICES LIST
- STRENGTHS & CHALLENGES
- AGRIVI LTD
- COMPANY OVERVIEW
- PRODUCTS / SERVICES LIST
- AIRBUS SAS
- COMPANY OVERVIEW
- PRODUCTS / SERVICES LIST
- STRENGTHS & CHALLENGES
- AT&T
- COMPANY OVERVIEW
- PRODUCTS / SERVICES LIST
- STRENGTHS & CHALLENGES
- CERES IMAGING
- COMPANY OVERVIEW
- PRODUCTS / SERVICES LIST
- CLAAS KGAA MBH
- COMPANY OVERVIEW
- PRODUCTS / SERVICES LIST
- STRENGTHS & CHALLENGES
- DEERE & COMPANY
- COMPANY OVERVIEW
- PRODUCTS / SERVICES LIST
- STRENGTHS & CHALLENGES
- FUJITSU
- COMPANY OVERVIEW
- PRODUCTS / SERVICES LIST
- STRENGTHS & CHALLENGES
- HEXAGON AB
- COMPANY OVERVIEW
- PRODUCTS / SERVICES LIST
- STRENGTHS & CHALLENGES
- IBM CORPORATION
- COMPANY OVERVIEW
- PRODUCTS / SERVICES LIST
- STRENGTHS & CHALLENGES
- MICROSOFT CORPORATION
- COMPANY OVERVIEW
- PRODUCTS / SERVICES LIST
- STRENGTHS & CHALLENGES
- RAVEN INDUSTRIES (ACQUIRED BY CNH INDUSTRIAL NV)
- COMPANY OVERVIEW
- PRODUCTS / SERVICES LIST
- STRENGTHS & CHALLENGES
- TOPCON CORPORATION
- COMPANY OVERVIEW
- PRODUCTS / SERVICES LIST
- STRENGTHS & CHALLENGES
- TRIMBLE INC
- COMPANY OVERVIEW
- PRODUCTS / SERVICES LIST
- STRENGTHS & CHALLENGES
- ACCENTURE
- KEY STRATEGIC DEVELOPMENTS
LIST OF TABLES
TABLE 1: MARKET SNAPSHOT – AGRICULTURE TECHNOLOGY AS A SERVICE
TABLE 2: GLOBAL AGRICULTURE TECHNOLOGY AS A SERVICE MARKET, BY TECHNOLOGY, HISTORICAL YEARS, 2018-2022 (IN $ MILLION)
TABLE 3: GLOBAL AGRICULTURE TECHNOLOGY AS A SERVICE MARKET, BY TECHNOLOGY, FORECAST YEARS, 2023-2032 (IN $ MILLION)
TABLE 4: GLOBAL DATA ANALYTICS & INTELLIGENCE MARKET, BY REGION, HISTORICAL YEARS, 2018-2022 (IN $ MILLION)
TABLE 5: GLOBAL DATA ANALYTICS & INTELLIGENCE MARKET, BY REGION, FORECAST YEARS, 2023-2032 (IN $ MILLION)
TABLE 6: GLOBAL GUIDANCE TECHNOLOGY MARKET, BY REGION, HISTORICAL YEARS, 2018-2022 (IN $ MILLION)
TABLE 7: GLOBAL GUIDANCE TECHNOLOGY MARKET, BY REGION, FORECAST YEARS, 2023-2032 (IN $ MILLION)
TABLE 8: GLOBAL SENSING TECHNOLOGY MARKET, BY REGION, HISTORICAL YEARS, 2018-2022 (IN $ MILLION)
TABLE 9: GLOBAL SENSING TECHNOLOGY MARKET, BY REGION, FORECAST YEARS, 2023-2032 (IN $ MILLION)
TABLE 10: GLOBAL VARIABLE RATE APPLICATION TECHNOLOGY MARKET, BY REGION, HISTORICAL YEARS, 2018-2022 (IN $ MILLION)
TABLE 11: GLOBAL VARIABLE RATE APPLICATION TECHNOLOGY MARKET, BY REGION, FORECAST YEARS, 2023-2032 (IN $ MILLION)
TABLE 12: GLOBAL OTHER TECHNOLOGIES MARKET, BY REGION, HISTORICAL YEARS, 2018-2022 (IN $ MILLION)
TABLE 13: GLOBAL OTHER TECHNOLOGIES MARKET, BY REGION, FORECAST YEARS, 2023-2032 (IN $ MILLION)
TABLE 14: GLOBAL AGRICULTURE TECHNOLOGY AS A SERVICE MARKET, BY TYPE, HISTORICAL YEARS, 2018-2022 (IN $ MILLION)
TABLE 15: GLOBAL AGRICULTURE TECHNOLOGY AS A SERVICE MARKET, BY TYPE, FORECAST YEARS, 2023-2032 (IN $ MILLION)
TABLE 16: GLOBAL SOFTWARE AS A SERVICE (SAAS) MARKET, BY REGION, HISTORICAL YEARS, 2018-2022 (IN $ MILLION)
TABLE 17: GLOBAL SOFTWARE AS A SERVICE (SAAS) MARKET, BY REGION, FORECAST YEARS, 2023-2032 (IN $ MILLION)
TABLE 18: GLOBAL EQUIPMENT AS A SERVICE (EAAS) MARKET, BY REGION, HISTORICAL YEARS, 2018-2022 (IN $ MILLION)
TABLE 19: GLOBAL EQUIPMENT AS A SERVICE (EAAS) MARKET, BY REGION, FORECAST YEARS, 2023-2032 (IN $ MILLION)
TABLE 20: GLOBAL AGRICULTURE TECHNOLOGY AS A SERVICE MARKET, BY APPLICATION, HISTORICAL YEARS, 2018-2022 (IN $ MILLION)
TABLE 21: GLOBAL AGRICULTURE TECHNOLOGY AS A SERVICE MARKET, BY APPLICATION, FORECAST YEARS, 2023-2032 (IN $ MILLION)
TABLE 22: GLOBAL YIELD MAPPING AND MONITORING MARKET, BY REGION, HISTORICAL YEARS, 2018-2022 (IN $ MILLION)
TABLE 23: GLOBAL YIELD MAPPING AND MONITORING MARKET, BY REGION, FORECAST YEARS, 2023-2032 (IN $ MILLION)
TABLE 24: GLOBAL SOIL MANAGEMENT MARKET, BY REGION, HISTORICAL YEARS, 2018-2022 (IN $ MILLION)
TABLE 25: GLOBAL SOIL MANAGEMENT MARKET, BY REGION, FORECAST YEARS, 2023-2032 (IN $ MILLION)
TABLE 26: GLOBAL CROP HEALTH MANAGEMENT MARKET, BY REGION, HISTORICAL YEARS, 2018-2022 (IN $ MILLION)
TABLE 27: GLOBAL CROP HEALTH MANAGEMENT MARKET, BY REGION, FORECAST YEARS, 2023-2032 (IN $ MILLION)
TABLE 28: GLOBAL NAVIGATION AND POSITIONING MARKET, BY REGION, HISTORICAL YEARS, 2018-2022 (IN $ MILLION)
TABLE 29: GLOBAL NAVIGATION AND POSITIONING MARKET, BY REGION, FORECAST YEARS, 2023-2032 (IN $ MILLION)
TABLE 30: GLOBAL OTHER APPLICATIONS MARKET, BY REGION, HISTORICAL YEARS, 2018-2022 (IN $ MILLION)
TABLE 31: GLOBAL OTHER APPLICATIONS MARKET, BY REGION, FORECAST YEARS, 2023-2032 (IN $ MILLION)
TABLE 32: GLOBAL AGRICULTURE TECHNOLOGY AS A SERVICE MARKET, BY GEOGRAPHY, HISTORICAL YEARS, 2018-2022 (IN $ MILLION)
TABLE 33: GLOBAL AGRICULTURE TECHNOLOGY AS A SERVICE MARKET, BY GEOGRAPHY, FORECAST YEARS, 2023-2032 (IN $ MILLION)
TABLE 34: NORTH AMERICA AGRICULTURE TECHNOLOGY AS A SERVICE MARKET, BY COUNTRY, HISTORICAL YEARS, 2018-2022 (IN $ MILLION)
TABLE 35: NORTH AMERICA AGRICULTURE TECHNOLOGY AS A SERVICE MARKET, BY COUNTRY, FORECAST YEARS, 2023-2032 (IN $ MILLION)
TABLE 36: LEADING PLAYERS OPERATING IN NORTH AMERICA AGRICULTURE TECHNOLOGY AS A SERVICE MARKET
TABLE 37: EUROPE AGRICULTURE TECHNOLOGY AS A SERVICE MARKET, BY COUNTRY, HISTORICAL YEARS, 2018-2022 (IN $ MILLION)
TABLE 38: EUROPE AGRICULTURE TECHNOLOGY AS A SERVICE MARKET, BY COUNTRY, FORECAST YEARS, 2023-2032 (IN $ MILLION)
TABLE 39: LEADING PLAYERS OPERATING IN EUROPE AGRICULTURE TECHNOLOGY AS A SERVICE MARKET
TABLE 40: ASIA-PACIFIC AGRICULTURE TECHNOLOGY AS A SERVICE MARKET, BY COUNTRY, HISTORICAL YEARS, 2018-2022 (IN $ MILLION)
TABLE 41: ASIA-PACIFIC AGRICULTURE TECHNOLOGY AS A SERVICE MARKET, BY COUNTRY, FORECAST YEARS, 2023-2032 (IN $ MILLION)
TABLE 42: LEADING PLAYERS OPERATING IN ASIA-PACIFIC AGRICULTURE TECHNOLOGY AS A SERVICE MARKET
TABLE 43: REST OF WORLD AGRICULTURE TECHNOLOGY AS A SERVICE MARKET, BY REGION, HISTORICAL YEARS, 2018-2022 (IN $ MILLION)
TABLE 44: REST OF WORLD AGRICULTURE TECHNOLOGY AS A SERVICE MARKET, BY REGION, FORECAST YEARS, 2023-2032 (IN $ MILLION)
TABLE 45: LEADING PLAYERS OPERATING IN REST OF WORLD AGRICULTURE TECHNOLOGY AS A SERVICE MARKET
TABLE 46: LIST OF PRODUCT LAUNCHES & DEVELOPMENTS
TABLE 47: LIST OF PARTNERSHIPS AND AGREEMENTS
TABLE 48: LIST OF BUSINESS EXPANSIONS & DIVESTITURES
LIST OF FIGURES
FIGURE 1: KEY TECHNOLOGY TRENDS
FIGURE 2: PORTER’S FIVE FORCES ANALYSIS
FIGURE 3: GROWTH PROSPECT MAPPING FOR NORTH AMERICA
FIGURE 4: GROWTH PROSPECT MAPPING FOR EUROPE
FIGURE 5: GROWTH PROSPECT MAPPING FOR ASIA-PACIFIC
FIGURE 6: GROWTH PROSPECT MAPPING FOR REST OF WORLD
FIGURE 7: MARKET MATURITY ANALYSIS
FIGURE 8: MARKET CONCENTRATION ANALYSIS
FIGURE 9: KEY BUYING CRITERIA
FIGURE 10: GLOBAL AGRICULTURE TECHNOLOGY AS A SERVICE MARKET, GROWTH POTENTIAL, BY TECHNOLOGY, IN 2022
FIGURE 11: GLOBAL AGRICULTURE TECHNOLOGY AS A SERVICE MARKET, BY DATA ANALYTICS & INTELLIGENCE, 2023-2032 (IN $ MILLION)
FIGURE 12: GLOBAL AGRICULTURE TECHNOLOGY AS A SERVICE MARKET, BY GUIDANCE TECHNOLOGY, 2023-2032 (IN $ MILLION)
FIGURE 13: GLOBAL AGRICULTURE TECHNOLOGY AS A SERVICE MARKET, BY SENSING TECHNOLOGY, 2023-2032 (IN $ MILLION)
FIGURE 14: GLOBAL AGRICULTURE TECHNOLOGY AS A SERVICE MARKET, BY VARIABLE RATE APPLICATION TECHNOLOGY, 2023-2032 (IN $ MILLION)
FIGURE 15: GLOBAL AGRICULTURE TECHNOLOGY AS A SERVICE MARKET, BY OTHER TECHNOLOGIES, 2023-2032 (IN $ MILLION)
FIGURE 16: GLOBAL AGRICULTURE TECHNOLOGY AS A SERVICE MARKET, GROWTH POTENTIAL, BY TYPE, IN 2022
FIGURE 17: GLOBAL AGRICULTURE TECHNOLOGY AS A SERVICE MARKET, BY SOFTWARE AS A SERVICE (SAAS), 2023-2032 (IN $ MILLION)
FIGURE 18: GLOBAL AGRICULTURE TECHNOLOGY AS A SERVICE MARKET, BY EQUIPMENT AS A SERVICE (EAAS), 2023-2032 (IN $ MILLION)
FIGURE 19: GLOBAL AGRICULTURE TECHNOLOGY AS A SERVICE MARKET, GROWTH POTENTIAL, BY APPLICATION, IN 2022
FIGURE 20: GLOBAL AGRICULTURE TECHNOLOGY AS A SERVICE MARKET, BY YIELD MAPPING AND MONITORING, 2023-2032 (IN $ MILLION)
FIGURE 21: GLOBAL AGRICULTURE TECHNOLOGY AS A SERVICE MARKET, BY SOIL MANAGEMENT, 2023-2032 (IN $ MILLION)
FIGURE 22: GLOBAL AGRICULTURE TECHNOLOGY AS A SERVICE MARKET, BY CROP HEALTH MANAGEMENT, 2023-2032 (IN $ MILLION)
FIGURE 23: GLOBAL AGRICULTURE TECHNOLOGY AS A SERVICE MARKET, BY NAVIGATION AND POSITIONING, 2023-2032 (IN $ MILLION)
FIGURE 24: GLOBAL AGRICULTURE TECHNOLOGY AS A SERVICE MARKET, BY OTHER APPLICATIONS, 2023-2032 (IN $ MILLION)
FIGURE 25: GLOBAL AGRICULTURE TECHNOLOGY AS A SERVICE MARKET, REGIONAL OUTLOOK, 2022 & 2032 (IN %)
FIGURE 26: NORTH AMERICA AGRICULTURE TECHNOLOGY AS A SERVICE MARKET, COUNTRY OUTLOOK, 2022 & 2032 (IN %)
FIGURE 27: UNITED STATES AGRICULTURE TECHNOLOGY AS A SERVICE MARKET, 2023-2032 (IN $ MILLION)
FIGURE 28: CANADA AGRICULTURE TECHNOLOGY AS A SERVICE MARKET, 2023-2032 (IN $ MILLION)
FIGURE 29: EUROPE AGRICULTURE TECHNOLOGY AS A SERVICE MARKET, COUNTRY OUTLOOK, 2022 & 2032 (IN %)
FIGURE 30: UNITED KINGDOM AGRICULTURE TECHNOLOGY AS A SERVICE MARKET, 2023-2032 (IN $ MILLION)
FIGURE 31: GERMANY AGRICULTURE TECHNOLOGY AS A SERVICE MARKET, 2023-2032 (IN $ MILLION)
FIGURE 32: FRANCE AGRICULTURE TECHNOLOGY AS A SERVICE MARKET, 2023-2032 (IN $ MILLION)
FIGURE 33: ITALY AGRICULTURE TECHNOLOGY AS A SERVICE MARKET, 2023-2032 (IN $ MILLION)
FIGURE 34: SPAIN AGRICULTURE TECHNOLOGY AS A SERVICE MARKET, 2023-2032 (IN $ MILLION)
FIGURE 35: NETHERLANDS AGRICULTURE TECHNOLOGY AS A SERVICE MARKET, 2023-2032 (IN $ MILLION)
FIGURE 36: REST OF EUROPE AGRICULTURE TECHNOLOGY AS A SERVICE MARKET, 2023-2032 (IN $ MILLION)
FIGURE 37: ASIA-PACIFIC AGRICULTURE TECHNOLOGY AS A SERVICE MARKET, COUNTRY OUTLOOK, 2022 & 2032 (IN%)
FIGURE 38: CHINA AGRICULTURE TECHNOLOGY AS A SERVICE MARKET, 2023-2032 (IN $ MILLION)
FIGURE 39: JAPAN AGRICULTURE TECHNOLOGY AS A SERVICE MARKET, 2023-2032 (IN $ MILLION)
FIGURE 40: INDIA AGRICULTURE TECHNOLOGY AS A SERVICE MARKET, 2023-2032 (IN $ MILLION)
FIGURE 41: SOUTH KOREA AGRICULTURE TECHNOLOGY AS A SERVICE MARKET, 2023-2032 (IN $ MILLION)
FIGURE 42: THAILAND AGRICULTURE TECHNOLOGY AS A SERVICE MARKET, 2023-2032 (IN $ MILLION)
FIGURE 43: INDONESIA AGRICULTURE TECHNOLOGY AS A SERVICE MARKET, 2023-2032 (IN $ MILLION)
FIGURE 44: AUSTRALIA & NEW ZEALAND AGRICULTURE TECHNOLOGY AS A SERVICE MARKET, 2023-2032 (IN $ MILLION)
FIGURE 45: REST OF ASIA-PACIFIC AGRICULTURE TECHNOLOGY AS A SERVICE MARKET, 2023-2032 (IN $ MILLION)
FIGURE 46: REST OF WORLD AGRICULTURE TECHNOLOGY AS A SERVICE MARKET, REGIONAL OUTLOOK, 2022 & 2032 (IN %)
FIGURE 47: LATIN AMERICA AGRICULTURE TECHNOLOGY AS A SERVICE MARKET, 2023-2032 (IN $ MILLION)
FIGURE 48: MIDDLE EAST & AFRICA AGRICULTURE TECHNOLOGY AS A SERVICE MARKET, 2023-2032 (IN $ MILLION)
FAQ’s
FAQs
ATaaS allows farmers to make data-driven decisions, increase productivity, reduce resource wastage, and enhance overall farming efficiency, leading to improved sustainability and profitability.
ATaaS can be adapted to various farm sizes and types, from small family farms to large commercial operations, offering scalability and customization.
Asia-Pacific is anticipated to witness the highest growth rate in the global Agriculture Technology as a Service market, between 2023 to 2032.
RELATED REPORTS
-

ASIA-PACIFIC BIOCHAR MARKET FORECAST 2024-2032
-

EUROPE BIOCHAR MARKET FORECAST 2024-2032
-

NORTH AMERICA BIOCHAR MARKET FORECAST 2024-2032
-
KENYA BIOCHAR MARKET FORECAST 2024-2032
-

INDIA BIOCHAR MARKET FORECAST 2024-2032
-

GLOBAL AGRICULTURAL BIOTECHNOLOGY MARKET FORECAST 2024-2032
-

GLOBAL BIOCHAR MARKET FORECAST 2024-2032
-

CHINA BIOCHAR MARKET FORECAST 2024-2032
-

GERMANY BIOCHAR MARKET FORECAST 2024-2032
-

UNITED STATES BIOCHAR MARKET FORECAST 2024-2032