

GLOBAL 3D RENDERING SERVICES MARKET FORECAST 2020-2028
Global 3d Rendering Services Market by Project Type (Commercial Projects, Residential Projects) by End User (Architects, Designers, Engineering Firms, Real Estate Companies) by Service Type (Interior Visualization, Exterior Visualization, Modeling Services, Walkthrough and Animation, Floor Plan) and by Geography.
According to Inkwood Research, the global 3D rendering services market will grow at an anticipated CAGR of 22.21% during the forecast period, and is predicted to garner revenue of $61.10 billion by 2028. The base year considered for the market study is 2019, while the forecasted period is between 2020 and 2028.
The global 3D rendering services market growth is driven by:
- Increasing need for real-time visualization in planning and designing
- Rising adoption of 3D rendering service
- Surging demand for real-time rendering and swift decision-making capabilities
3D rendering has turned out to be one of the most essential requirements for designers in recent years. Digital advancement in the field of construction has increased the adoption of 3D rendering services. A number of architectural and engineering firms use 3D building models and digital renderings tools for digitally creating a 3D model of the finished results. In addition, this service provides convenient sharing options to designers, as 3D architectural renderings are easy to share and save time by sending the 3D render to customers instead of meeting in person. 3D interior visualizations assist designers in providing effective presentations to their clients. 3D rendering services not only hasten the design process, but also enables designers and architects to come up with different ideas in designing, along with identifying potential design problems. Thus, the need for better resource management in various construction companies is driving the adoption of 3D rendering services.
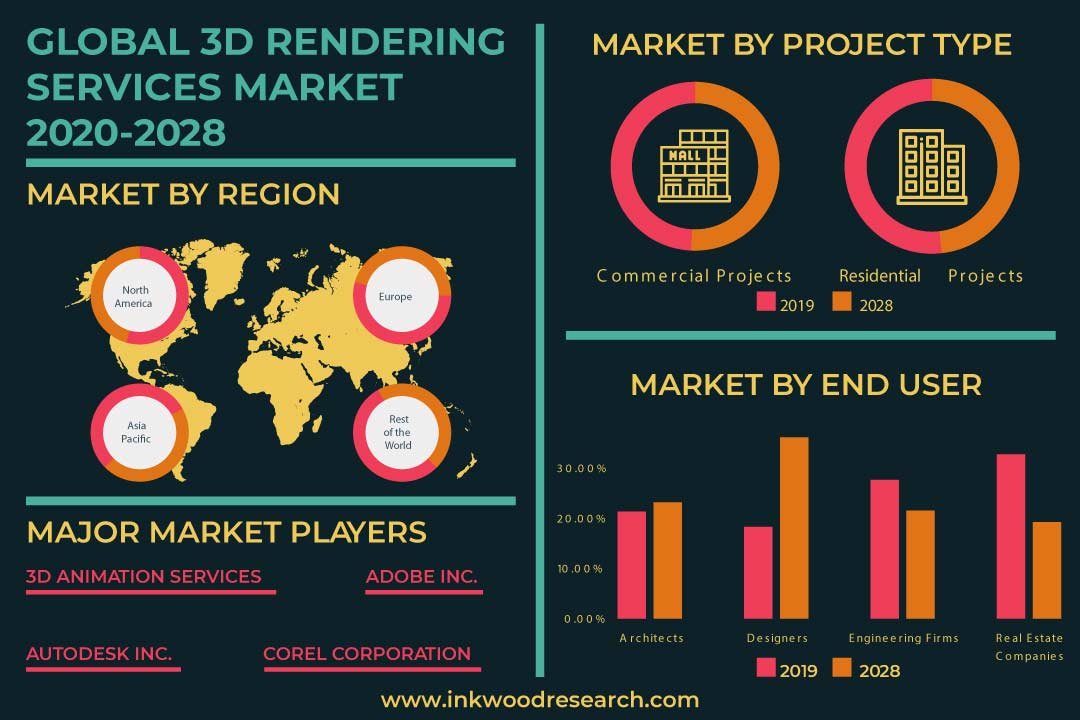
The real estate companies category dominated in terms of revenue in the global 3D rendering services market, in the end-user segment, with around 32.75% market share in 2019. A significant increase in investment in these sectors drives the adoption of the latest technologies and tools such as 3D modeling, animation, and rendering software. For instance, according to the data from Jones Lang LaSalle IP, Inc. (JLL), London has been the leading city for global real estate investment in 2017. There has been an increase of around 48% in the city investment in London as compared to 2016. In addition, 3D rendering saves time and money for real estate companies, as it reduces the significant amount of time spent in producing sketches and models. It is integrated and comprehensive in nature and its walkthroughs can be repurposed and utilized for testing real-life scenarios and other construction-related purposes such as planning, documentation, and management. The designers category is anticipated to record the highest CAGR of around 31.37% in the end-user segment during the forecast period.
On the other hand, the global 3D rendering services market growth is restricted by security and privacy concerns, and a lack of skilled professionals. The 3D rendering industry is witnessing a dearth of skilled professionals, due to the lack of knowledge. In addition, another study found that the young generation lacks interest in working with new lines of machines such as 3D rendering services. Several companies are training their existing workforce about 3D rendering skills. However, it is time-consuming, resulting in backlogs in work. The operation of 3D rendering services software requires a number of skilled professionals, and with the current scenario, the talent pool is comparatively small, which limits the growth of the market.
The report on the global 3D rendering services market includes segmentation analysis on the basis of service type, project type, and end-user.
Market by Project Type:
- Commercial Projects
- Residential Projects
Market by End-User:
- Engineering Firms
- Designers
- Architects
- Real Estate Companies
Market by Service Type:
- Walkthrough and Animation
- Exterior Visualization
- Floor Plan
- Interior Visualization
- Modeling Services
On the basis of geography, the global 3D rendering services market has been segmented into four major regions:
- North America: the United States and Canada
- Europe: the United Kingdom, Germany, France, Italy, Russia, Belgium, Poland, and Rest of Europe
- Asia-Pacific: China, Japan, India, South Korea, Indonesia, Thailand, Vietnam, Australia & New Zealand, and Rest of Asia Pacific
- Rest of World: Latin America, the Middle East & Africa
Geographically, North America is the largest market with a market share of 37.47% in terms of revenue in 2019. The dominance of North America is attributed to the increasing utilization of 3D rendering services for marketing activities that have proved beneficial for construction firms and architects in the past few years. For instance, it has been observed that real estate companies that use 3D rendering services have garnered 350–400% more profits than the other companies that don’t use 3D rendering services. According to AIA Consensus Construction Forecast, the construction spending for non-residential buildings witnessed an increase of 4% in 2018, and this trend is anticipated to be observed in the year 2019, which will boost the market growth.
On the other hand, Asia Pacific is set to be the fastest-growing region with a CAGR of 24.08% during the forecast period. The growth is attributed to the increasing need for visualization and 3D rendering software in this region. The emerging countries such as India, China, and Japan Asia Pacific region has witnessed rapid growth in urbanization and industrialization. Significant advancements in 3D technology have been witnessed, owing to the growing adoption of 3D rendering services among organizations to enhance productivity and reduce the cost of production. The rising demand for real-time rendering in this region has created lucrative opportunities for the global 3D rendering services market. For instance, according to a survey conducted by CGarchitect’s in 2018, 10.5% of the organization is using real-time rendering for enhancing productivity in organizations and reducing the cost of production in Asian countries.
The major key players involved in the global 3D rendering services market are:
- Adobe Inc
- Autodesk Inc
- Corel Corporation
- NVIDIA Corporation
- Siemens AG
- Others
In April 2019, Adobe announced the launch of Dimension, a tool for designers creating 3D objects or scenes. The major update is Cloud Rendering, which speeds up the workflows of users.
Key findings of the global 3D rendering services market:
- North America dominates the global 3D rendering services market by capturing the largest market share of around 37.47% in 2019.
- The Asia Pacific market is anticipated to grow at the highest CAGR of 24.08% during the forecast period, 2020-2028.
- The surging adoption of cloud-based 3D rendering services is one of the major factors boosting the growth of the market.
- The adoption of 3D rendering services is estimated to create lucrative opportunities for advertisers and marketers.
- RESEARCH SCOPE & METHODOLOGY
- STUDY OBJECTIVES
- SCOPE OF STUDY
- METHODOLOGY
- ASSUMPTIONS & LIMITATIONS
- EXECUTIVE SUMMARY
- MARKET SIZE & ESTIMATES
- MARKET OVERVIEW
- MARKET DYNAMICS
- MARKET DEFINITION
- KEY DRIVERS
- INCREASING NEED FOR REAL-TIME VISUALIZATION IN PLANNING AND DESIGNING
- RISE IN ADOPTION OF 3D RENDERING SERVICE
- SURGE IN DEMAND FOR REAL-TIME RENDERING AND FASTER DECISION-MAKING CAPABILITIES
- KEY RESTRAINTS
- SECURITY AND PRIVACY CONCERNS
- LACK OF SKILLED PROFESSIONALS
- KEY ANALYTICS
- KEY INVESTMENT INSIGHTS
- PORTER’S FIVE FORCE ANALYSIS
- BUYER POWER
- SUPPLIER POWER
- SUBSTITUTION
- NEW ENTRANTS
- INDUSTRY RIVALRY
- OPPORTUNITY MATRIX
- VENDOR LANDSCAPE
- MARKET BY PROJECT TYPE
- COMMERCIAL PROJECTS
- RESIDENTIAL PROJECTS
- MARKET BY END USER
- ARCHITECTS
- DESIGNERS
- ENGINEERING FIRMS
- REAL ESTATE COMPANIES
- MARKET BY SERVICE TYPE
- INTERIOR VISUALIZATION
- EXTERIOR VISUALIZATION
- MODELING SERVICES
- WALKTHROUGH AND ANIMATION
- FLOOR PLAN
- GEOGRAPHICAL ANALYSIS
- NORTH AMERICA
- UNITED STATES
- CANADA
- EUROPE
- UNITED KINGDOM
- GERMANY
- FRANCE
- ITALY
- RUSSIA
- BELGIUM
- POLAND
- REST OF EUROPE
- ASIA PACIFIC
- CHINA
- JAPAN
- INDIA
- SOUTH KOREA
- INDONESIA
- THAILAND
- VIETNAM
- AUSTRALIA & NEW ZEALAND
- REST OF ASIA PACIFIC
- REST OF WORLD
- LATIN AMERICA
- MIDDLE EAST & AFRICA
- NORTH AMERICA
- COMPANY PROFILES
- 3D ANIMATION SERVICES
- ADOBE INC
- AUTODESK INC
- COREL CORPORATION
- FLATWORLD SOLUTIONS PVT LTD
- NVIDIA CORPORATION
- RAYVAT RENDERING
- SIEMENS AG
- TESLA OUTSOURCING SERVICES
- XPRESSRENDERING
- V RENDER
- EASY RENDER
- ARCHI CGI
- POWER RENDERING
- BRICK VISUAL
LIST OF TABLES
TABLE 1: MARKET SNAPSHOT – 3D RENDERING SERVICES
TABLE 2: GLOBAL 3D RENDERING SERVICES MARKET, BY PROJECT TYPE, HISTORICAL YEARS, 2016-2019 (IN $ MILLION)
TABLE 3: GLOBAL 3D RENDERING SERVICES MARKET, BY PROJECT TYPE, FORECAST YEARS, 2020-2028 (IN $ MILLION)
TABLE 4: GLOBAL COMMERCIAL PROJECTS MARKET, BY REGION, HISTORICAL YEARS, 2016-2019 (IN $ MILLION)
TABLE 5: GLOBAL COMMERCIAL PROJECTS MARKET, BY REGION, FORECAST YEARS, 2020-2028 (IN $ MILLION)
TABLE 6: GLOBAL RESIDENTIAL PROJECTS MARKET, BY REGION, HISTORICAL YEARS, 2016-2019 (IN $ MILLION)
TABLE 7: GLOBAL RESIDENTIAL PROJECTS MARKET, BY REGION, FORECAST YEARS, 2020-2028 (IN $ MILLION)
TABLE 8: GLOBAL 3D RENDERING SERVICES MARKET, BY END USER, HISTORICAL YEARS, 2016-2019 (IN $ MILLION)
TABLE 9: GLOBAL 3D RENDERING SERVICES MARKET, BY END USER, FORECAST YEARS, 2020-2028 (IN $ MILLION)
TABLE 10: GLOBAL ARCHITECTS MARKET, BY REGION, HISTORICAL YEARS, 2016-2019 (IN $ MILLION)
TABLE 11: GLOBAL ARCHITECTS MARKET, BY REGION, FORECAST YEARS, 2020-2028 (IN $ MILLION)
TABLE 12: GLOBAL DESIGNERS MARKET, BY REGION, HISTORICAL YEARS, 2016-2019 (IN $ MILLION)
TABLE 13: GLOBAL DESIGNERS MARKET, BY REGION, FORECAST YEARS, 2020-2028 (IN $ MILLION)
TABLE 14: GLOBAL ENGINEERING FIRMS MARKET, BY REGION, HISTORICAL YEARS, 2016-2019 (IN $ MILLION)
TABLE 15: GLOBAL ENGINEERING FIRMS MARKET, BY REGION, FORECAST YEARS, 2020-2028 (IN $ MILLION)
TABLE 16: GLOBAL REAL ESTATE COMPANIES MARKET, BY REGION, HISTORICAL YEARS, 2016-2019 (IN $ MILLION)
TABLE 17: GLOBAL REAL ESTATE COMPANIES MARKET, BY REGION, FORECAST YEARS, 2020-2028 (IN $ MILLION)
TABLE 18: GLOBAL 3D RENDERING SERVICES MARKET, BY SERVICE TYPE, HISTORICAL YEARS, 2016-2019 (IN $ MILLION)
TABLE 19: GLOBAL 3D RENDERING SERVICES MARKET, BY SERVICE TYPE, FORECAST YEARS, 2020-2028 (IN $ MILLION)
TABLE 20: GLOBAL INTERIOR VISUALIZATION MARKET, BY REGION, HISTORICAL YEARS, 2016-2019 (IN $ MILLION)
TABLE 21: GLOBAL INTERIOR VISUALIZATION MARKET, BY REGION, FORECAST YEARS, 2020-2028 (IN $ MILLION)
TABLE 22: GLOBAL EXTERIOR VISUALIZATION MARKET, BY REGION, HISTORICAL YEARS, 2016-2019 (IN $ MILLION)
TABLE 23: GLOBAL EXTERIOR VISUALIZATION MARKET, BY REGION, FORECAST YEARS, 2020-2028 (IN $ MILLION)
TABLE 24: GLOBAL MODELLING SERVICES MARKET, BY REGION, HISTORICAL YEARS, 2016-2019 (IN $ MILLION)
TABLE 25: GLOBAL MODELLING SERVICES MARKET, BY REGION, FORECAST YEARS, 2020-2028 (IN $ MILLION)
TABLE 26: GLOBAL WALKTHROUGH AND ANIMATION MARKET, BY REGION, HISTORICAL YEARS, 2016-2019 (IN $ MILLION)
TABLE 27: GLOBAL WALKTHROUGH AND ANIMATION MARKET, BY REGION, FORECAST YEARS, 2020-2028 (IN $ MILLION)
TABLE 28: GLOBAL FLOOR PLAN MARKET, BY REGION, HISTORICAL YEARS, 2016-2019 (IN $ MILLION)
TABLE 29: GLOBAL FLOOR PLAN MARKET, BY REGION, FORECAST YEARS, 2020-2028 (IN $ MILLION)
TABLE 30: GLOBAL 3D RENDERING SERVICES MARKET, BY GEOGRAPHY, HISTORICAL YEARS, 2016-2019 (IN $ MILLION)
TABLE 31: GLOBAL 3D RENDERING SERVICES MARKET, BY GEOGRAPHY, FORECAST YEARS, 2020-2028 (IN $ MILLION)
TABLE 32: NORTH AMERICA 3D RENDERING SERVICES MARKET, BY COUNTRY, HISTORICAL YEARS, 2016-2019 (IN $ MILLION)
TABLE 33: NORTH AMERICA 3D RENDERING SERVICES MARKET, BY COUNTRY, FORECAST YEARS, 2020-2028 (IN $ MILLION)
TABLE 34: EUROPE 3D RENDERING SERVICES MARKET, BY COUNTRY, HISTORICAL YEARS, 2016-2019 (IN $ MILLION)
TABLE 35: EUROPE 3D RENDERING SERVICES MARKET, BY COUNTRY, FORECAST YEARS, 2020-2028 (IN $ MILLION)
TABLE 36: ASIA PACIFIC 3D RENDERING SERVICES MARKET, BY COUNTRY, HISTORICAL YEARS, 2016-2019 (IN $ MILLION)
TABLE 37: ASIA PACIFIC 3D RENDERING SERVICES MARKET, BY COUNTRY, FORECAST YEARS, 2020-2028 (IN $ MILLION)
TABLE 38: REST OF WORLD 3D RENDERING SERVICES MARKET, BY REGION, HISTORICAL YEARS, 2016-2019 (IN $ MILLION)
TABLE 39: REST OF WORLD 3D RENDERING SERVICES MARKET, BY REGION, FORECAST YEARS, 2020-2028 (IN $ MILLION)
LIST OF FIGURES
FIGURE 1: KEY INVESTMENT INSIGHTS
FIGURE 2: PORTER’S FIVE FORCE ANALYSIS
FIGURE 3: OPPORTUNITY MATRIX
FIGURE 4: VENDOR LANDSCAPE
FIGURE 5: GLOBAL 3D RENDERING SERVICES MARKET, GROWTH POTENTIAL, BY PROJECT TYPE, IN 2019
FIGURE 6: GLOBAL 3D RENDERING SERVICES MARKET, BY COMMERCIAL PROJECTS, 2020-2028 (IN $ MILLION)
FIGURE 7: GLOBAL 3D RENDERING SERVICES MARKET, BY RESIDENTIAL PROJECTS, 2020-2028 (IN $ MILLION)
FIGURE 8: GLOBAL 3D RENDERING SERVICES MARKET, GROWTH POTENTIAL, BY END USER, IN 2019
FIGURE 9: GLOBAL 3D RENDERING SERVICES MARKET, BY ARCHITECTS, 2020-2028 (IN $ MILLION)
FIGURE 10: GLOBAL 3D RENDERING SERVICES MARKET, BY DESIGNERS, 2020-2028 (IN $ MILLION)
FIGURE 11: GLOBAL 3D RENDERING SERVICES MARKET, BY ENGINEERING FIRMS, 2020-2028 (IN $ MILLION)
FIGURE 12: GLOBAL 3D RENDERING SERVICES MARKET, BY REAL ESTATE COMPANIES, 2020-2028 (IN $ MILLION)
FIGURE 13: GLOBAL 3D RENDERING SERVICES MARKET, GROWTH POTENTIAL, BY SERVICE TYPE, IN 2019
FIGURE 14: GLOBAL 3D RENDERING SERVICES MARKET, BY INTERIOR VISUALIZATION, 2020-2028 (IN $ MILLION)
FIGURE 15: GLOBAL 3D RENDERING SERVICES MARKET, BY EXTERIOR VISUALIZATION, 2020-2028 (IN $ MILLION)
FIGURE 16: GLOBAL 3D RENDERING SERVICES MARKET, BY MODELLING SERVICES, 2020-2028 (IN $ MILLION)
FIGURE 17: GLOBAL 3D RENDERING SERVICES MARKET, BY WALKTHROUGH AND ANIMATION, 2020-2028 (IN $ MILLION)
FIGURE 18: GLOBAL 3D RENDERING SERVICES MARKET, BY FLOOR PLAN, 2020-2028 (IN $ MILLION)
FIGURE 19: NORTH AMERICA 3D RENDERING SERVICES MARKET, REGIONAL OUTLOOK, 2019 & 2028 (IN %)
FIGURE 20: UNITED STATES 3D RENDERING SERVICES MARKET, 2020-2028 (IN $ MILLION)
FIGURE 21: CANADA 3D RENDERING SERVICES MARKET, 2020-2028 (IN $ MILLION)
FIGURE 22: EUROPE 3D RENDERING SERVICES MARKET, REGIONAL OUTLOOK, 2019 & 2028 (IN %)
FIGURE 23: UNITED KINGDOM 3D RENDERING SERVICES MARKET, 2020-2028 (IN $ MILLION)
FIGURE 24: GERMANY 3D RENDERING SERVICES MARKET, 2020-2028 (IN $ MILLION)
FIGURE 25: FRANCE 3D RENDERING SERVICES MARKET, 2020-2028 (IN $ MILLION)
FIGURE 26: ITALY 3D RENDERING SERVICES MARKET, 2020-2028 (IN $ MILLION)
FIGURE 27: RUSSIA 3D RENDERING SERVICES MARKET, 2020-2028 (IN $ MILLION)
FIGURE 28: BELGIUM 3D RENDERING SERVICES MARKET, 2020-2028 (IN $ MILLION)
FIGURE 29: POLAND 3D RENDERING SERVICES MARKET, 2020-2028 (IN $ MILLION)
FIGURE 30: REST OF EUROPE 3D RENDERING SERVICES MARKET, 2020-2028 (IN $ MILLION)
FIGURE 31: ASIA PACIFIC 3D RENDERING SERVICES MARKET, REGIONAL OUTLOOK, 2019 & 2028 (IN %)
FIGURE 32: CHINA 3D RENDERING SERVICES MARKET, 2020-2028 (IN $ MILLION)
FIGURE 33: JAPAN 3D RENDERING SERVICES MARKET, 2020-2028 (IN $ MILLION)
FIGURE 34: INDIA 3D RENDERING SERVICES MARKET, 2020-2028 (IN $ MILLION)
FIGURE 35: SOUTH KOREA 3D RENDERING SERVICES MARKET, 2020-2028 (IN $ MILLION)
FIGURE 36: INDONESIA 3D RENDERING SERVICES MARKET, 2020-2028 (IN $ MILLION)
FIGURE 37: THAILAND 3D RENDERING SERVICES MARKET, 2020-2028 (IN $ MILLION)
FIGURE 38: VIETNAM 3D RENDERING SERVICES MARKET, 2020-2028 (IN $ MILLION)
FIGURE 39: AUSTRALIA & NEW ZEALAND 3D RENDERING SERVICES MARKET, 2020-2028 (IN $ MILLION)
FIGURE 40: REST OF ASIA PACIFIC 3D RENDERING SERVICES MARKET, 2020-2028 (IN $ MILLION
FIGURE 41: REST OF WORLD 3D RENDERING SERVICES MARKET, REGIONAL OUTLOOK, 2019 & 2028 (IN %)
FIGURE 42: LATIN AMERICA 3D RENDERING SERVICES MARKET, 2020-2028 (IN $ MILLION)
FIGURE 43: MIDDLE EAST & AFRICA 3D RENDERING SERVICES MARKET, 2020-2028 (IN $ MILLION)
- MARKET BY PROJECT TYPE
- COMMERCIAL PROJECTS
- RESIDENTIAL PROJECTS
- MARKET BY END USER
- ARCHITECTS
- DESIGNERS
- ENGINEERING FIRMS
- REAL ESTATE COMPANIES
- MARKET BY SERVICE TYPE
- INTERIOR VISUALIZATION
- EXTERIOR VISUALIZATION
- MODELING SERVICES
- WALKTHROUGH AND ANIMATION
- FLOOR PLAN
- GEOGRAPHICAL ANALYSIS
- NORTH AMERICA
- UNITED STATES
- CANADA
- EUROPE
- UNITED KINGDOM
- GERMANY
- FRANCE
- ITALY
- RUSSIA
- BELGIUM
- POLAND
- REST OF EUROPE
- ASIA PACIFIC
- CHINA
- JAPAN
- INDIA
- SOUTH KOREA
- INDONESIA
- THAILAND
- VIETNAM
- AUSTRALIA & NEW ZEALAND
- REST OF ASIA PACIFIC
- REST OF WORLD
- LATIN AMERICA
- MIDDLE EAST & AFRICA
- NORTH AMERICA
To request a free sample copy of this report, please complete the form below :
We offer 10% free customization including country-level data, niche applications and competitive landscape with every report.
Choose License Type
RELATED REPORTS
-

GLOBAL GAMING MARKET FORECAST 2025-2032
-

ASIA-PACIFIC GAMING MARKET FORECAST 2025-2032
-

EUROPE GAMING MARKET FORECAST 2025-2032
-

NORTH AMERICA GAMING MARKET FORECAST 2025-2032
-

INDONESIA GAMING MARKET FORECAST 2025-2032
-

BRAZIL GAMING MARKET FORECAST 2025-2032
-

JAPAN GAMING MARKET FORECAST 2025-2032
-

GLOBAL CODING & MARKING MARKET FORECAST 2025-2032
-

ASIA-PACIFIC CODING & MARKING MARKET FORECAST 2025-2032
-

EUROPE CODING & MARKING MARKET FORECAST 2025-2032