Table of Contents

This analysis is brought to you by Inkwood Research, a leading market intelligence firm specializing in market forecasting, revenue growth projections, and financial modeling for global sectors. Our research team brings extensive expertise in CAGR calculation, trend analysis, and investment decision metrics across North America, Europe, and Asia-Pacific. Through strategic partnerships with institutional investors, corporate strategy teams, and sector analysts, we deliver clear, credible market forecast analysis that supports high-stakes business decisions.
TLDR
CAGR, the Compound Annual Growth Rate, is the most widely used growth metric in market research, and for good reason. It converts multi-year market trajectories into a single, comparable figure that cuts through noise. Yet many business users misread it, overextend its implications, or miss what it does not tell them. This blog explains the CAGR formula, how it is applied in CAGR in market reports, and how to use it effectively for forecasting, investment decisions, and strategy.
This blog is directly relevant for investors, business analysts, and corporate strategy teams who regularly interact with market research forecasts. Furthermore, financial modelers building revenue growth projections, procurement leads benchmarking market growth rates, and executives evaluating market entry or expansion decisions will find clear, practical insight here on how CAGR functions across real reporting contexts.
What Is CAGR and Why Does It Matter in Market Research?

CAGR (Compound Annual Growth Rate) is the annualized growth rate of an investment or market over a specified period, assuming steady growth. In practical terms, it answers a very specific question: if a market grew from Point A to Point B over several years, what consistent annual rate would explain that trajectory?
The appeal of the CAGR meaning in business communication is its simplicity. Rather than presenting a multi-year table of growth rates, which can vary year to year due to market cycles, one-time events, or data revisions, CAGR smooths the trajectory into a single, intuitive figure. Consequently, it has become the standard reporting metric across virtually every industry research report, investor deck, and market forecast.
Additionally, CAGR facilitates comparison. When evaluating two markets or two investment options, a consistent annual growth rate metric allows decision-makers to benchmark performance on a like-for-like basis, regardless of the absolute size of each market.
A Southeast Asian conglomerate approached Inkwood Research to benchmark CAGR trajectories across five potential acquisition targets in the renewable energy sector. By modeling CAGR across comparable forecast periods and standardizing the scope of each market definition, our team enabled an apples-to-apples comparison that reduced the shortlist from five to two high-conviction opportunities, significantly accelerating the client’s investment decision process.
What Is the CAGR Formula and How Is It Calculated?

The CAGR formula is straightforward:
CAGR = (Ending Value / Beginning Value)^(1 / Number of Years) − 1
CAGR Calculation Example
Consider a market valued at $50 billion in 2024, projected to reach $80 billion by 2030. Applying the formula: CAGR = ($80B / $50B)^(1/6) − 1 = approximately 8.1%. This means the market is expected to grow at roughly 8.1% per year on average over that six-year period, even if individual years vary significantly above or below that rate.
Furthermore, CAGR calculation is sensitive to the choice of start and end points. A market that dipped sharply in the base year will show an inflated CAGR simply because it is recovering from a low starting point. Conversely, a market at a cyclical peak in its base year may report a misleadingly low CAGR. Therefore, context around the base year always matters when interpreting CAGR figures.
Using CAGR vs. Simple Annual Growth Rate
Simple year-on-year growth rates capture what actually happened in each period. CAGR, by contrast, smooths that path into a single consistent rate. Neither is superior in isolation; the right metric depends on what question is being asked. For long-range forecasting and cross-market comparison, CAGR vs growth rate discussions almost always favor CAGR because it removes the distorting effect of individual year volatility.
How Is CAGR Used in Market Research and Forecasting?

In market research, CAGR in market reports serves several distinct functions beyond simple growth communication.
CAGR as a Demand Signal for Investors
For investors, CAGR investment analysis provides a quick first filter. A market growing at 15% CAGR is structurally different from one growing at 3%, in terms of competitive dynamics, entry timing, and return potential. Accordingly, investors use CAGR for business strategy to prioritize sectors, screen acquisition targets, and set return expectations before entering deeper due diligence.
A North American venture capital firm used Inkwood Research’s market forecast analysis to evaluate the CAGR trajectories of three adjacent precision agriculture technology markets. Our structured comparison of CAGR figures, segmented by geography and application type, helped the client identify that its preferred market had a headline CAGR of 14%, but a substantially higher 21% CAGR in the specific sub-segment it was targeting. This granularity was instrumental in the firm’s investment thesis presentation.
CAGR in Market Forecasting Models
Market analysts build forecasting models by projecting revenues, volumes, or units forward from a validated base year. CAGR assumptions feed directly into these models, with different CAGR rates often applied to different segments, geographies, or time horizons to reflect varying growth dynamics. Moreover, scenario analysis, applying optimistic, base, and conservative CAGRs, helps stakeholders understand the range of plausible outcomes rather than a single-point forecast.
Why CAGR Is Important for Investors and Boards
Beyond its analytical function, CAGR serves a communication role. Board presentations, investor decks, and analyst briefings all use why CAGR is important for investors as a compact, credible signal of market trajectory. A single CAGR figure can convey growth momentum more effectively than a table of annual growth rates, provided its limitations are understood by the audience.
What Are the Limitations of CAGR in Market Reports?

Despite its ubiquity, CAGR has real limitations that every user of market research data should understand.
CAGR Does Not Show Volatility
Because it smooths growth into a single rate, CAGR obscures what actually happens in each year. A market that contracted sharply in Year 2 and recovered strongly in Years 3–5 may report the same CAGR as one that grew steadily throughout. For businesses making operational plans year-by-year, this distinction matters enormously.
Start and End Point Sensitivity
As discussed, CAGR calculation is highly sensitive to base-year conditions. Markets measured from a recession trough or a pandemic disruption will show inflated CAGRs during the recovery period. Similarly, markets captured at a cyclical peak may report lower CAGRs simply because of where the measurement starts. Consequently, reading the base-year context is essential to interpreting CAGR figures correctly.
CAGR Cannot Predict Disruption
Exponential growth rate assumptions embedded in a CAGR figure assume a form of continuity that real markets often violate. Regulatory changes, technological disruption, supply chain shocks, and geopolitical events can radically alter trajectories in ways that no historical CAGR captures. For this reason, credible market forecast CAGR reports always accompany their projections with a qualitative discussion of key risks and assumptions.
CAGR vs. Other Growth Metrics: What Is the Difference?
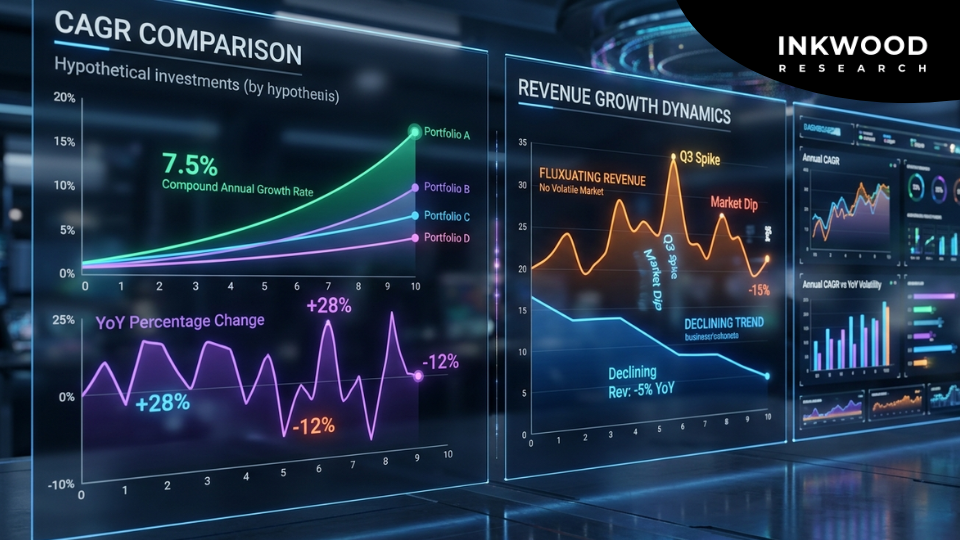
Understanding where CAGR fits within the broader toolkit of growth measurement helps analysts apply the right metric to the right question.
- CAGR vs. absolute growth: Absolute growth tells you the dollar or unit increase between two periods. CAGR tells you the annualized rate. Both matter; a 10% CAGR on a $1 billion market is far more valuable in absolute terms than a 10% CAGR on a $50 million market.
- CAGR vs. YoY growth rate: Year-on-year growth captures actual annual performance and is useful for tracking real market dynamics. CAGR is a smoothed average, better suited for forecasting and comparison than for operational performance review.
- CAGR vs. revenue growth projections: Revenue growth projections at the company level often differ from market CAGR because individual firm performance depends on market share gains, pricing strategy, and product mix, not just overall market growth.
According to the U.S. Securities and Exchange Commission’s guidance on financial projections, growth rate metrics in investor communications should be accompanied by clear disclosure of the assumptions and time periods underlying them, a standard that rigorous market research firms apply to their CAGR reporting as well.
How Inkwood Research Uses CAGR in Market Forecast Analysis

At Inkwood Research, what is CAGR in market research is not treated as a single output but as a structured analytical process. Our market forecast analysis begins with a validated base-year market size, then applies segmented growth assumptions derived from primary research, trade data, and regulatory outlook assessments.
Moreover, we present CAGRs at the segment, geography, and application level, rather than a single blended rate, so that business users can identify where growth is actually concentrated. Additionally, our reports include scenario-based CAGR ranges under conservative, base, and optimistic assumptions, giving clients the flexibility to stress-test projections against different market conditions.
Our growth rate analysis reports are designed for decision-makers who need both the number and the reasoning behind it. Whether you are evaluating a market entry, structuring an acquisition case, or building an investor presentation, a well-constructed CAGR analysis from Inkwood Research provides a credible, defensible foundation.
A European industrial equipment manufacturer engaged Inkwood Research to provide CAGR analysis for the Asia-Pacific market in three adjacent product categories. Our team delivered segmented CAGR projections by country and application, with scenario ranges clearly documented. The client used the analysis to prioritize manufacturing investment in India and Vietnam, markets where the sub-segment CAGR significantly outpaced the regional blended rate.
Key Takeaways
- CAGR meaning is the annualized growth rate that smooths a multi-year market trajectory into a single comparable figure.
- The CAGR formula is: (Ending Value / Beginning Value)^(1 / Years) − 1. Context around the base year is always essential to correct interpretation.
- CAGR in market reports serves as both an analytical metric and a communication tool for investors, boards, and strategy teams.
- CAGR does not show year-by-year volatility, is sensitive to start and end points, and cannot predict disruption, limitations that credible reports acknowledge explicitly.
- CAGR investment analysis is most powerful when segmented by geography and application rather than reported as a single blended rate.
- Market forecast CAGR reports from Inkwood Research include scenario ranges and documented assumptions for maximum analytical utility.
Conclusion
CAGR is one of the most useful and most misused metrics in market research. Used correctly, it provides a clear, comparable signal of market trajectory that supports investment decisions, competitive benchmarking, and strategic planning. Used uncritically, it can create false confidence in projections that mask underlying volatility or rest on questionable base-year assumptions.
The difference lies in methodology, transparency, and contextual judgment, exactly what rigorous market forecast analysis from Inkwood Research is built to deliver.
Connect with our team to explore how our CAGR for business strategy reports can support your next market analysis or investment decision.
Frequently Asked Questions (FAQs)
CAGR is the annualized growth rate over a specified period. It is used because it provides a single, comparable growth metric that smooths year-to-year volatility and enables cross-market benchmarking.
Apply the formula: (Ending Value / Beginning Value)^(1 / Number of Years) − 1. Always verify the base year and forecast year before interpreting the result in context.
Simple annual growth rate measures actual year-on-year change. CAGR is a smoothed average across the full period, more useful for forecasting and comparison, less useful for tracking actual year-by-year performance.
CAGR provides a quick, standardized filter for comparing growth trajectories across sectors and investment opportunities, supporting portfolio prioritization and entry timing decisions efficiently.
CAGR masks year-by-year volatility, is sensitive to base-year selection, and cannot account for structural disruptions. Credible reports pair CAGR figures with qualitative risk discussion and scenario analysis.
Inkwood Research delivers segmented CAGRs by geography, application, and scenario, with clearly documented assumptions, so clients can identify where growth is concentrated and stress-test projections as needed.