
GLOBAL VR IN HEALTHCARE MARKET FORECAST 2022-2030
Global VR in Healthcare Market by End-user (Hospitals & Clinics, Research Laboratories, Others) Market by Application (Surgical Planning, Behavioral Neurology/rehabilitation, Pain Management, Other Applications) Market by Component (Hardware, Software) Market by Product Type (VR Semiconductor Components, VR Devices, VR Sensors, Others) Market by Technology (Head Mounted, Gesture Tracking, Projectors and Displays) by Geography
In terms of revenue, the global VR in healthcare market was valued at $xx billion in 2021 and is expected to reach $4.58 billion by 2030, growing at a CAGR of 30.62% during the forecast period. The market study has also analyzed the impact of COVID-19 on the global VR in healthcare market qualitatively as well as quantitatively.
To learn more about this report, request a free sample copy
Virtual reality (VR) comprises VR headsets and software that create simulated environments for various applications such as gaming, entertainment, education, healthcare, simulation & training, etc. It also provides users with easy access to a simulated 3D environment. In some cases, vision, in addition to other senses such as hearing, touch, and smell, is simulated to acquire a better experience.
Read our latest blog on the VR in Healthcare Market
In healthcare, virtual reality can be used for diagnosis, education and training, pain management, surgery, and others. Moreover, healthcare is becoming one of the most important sectors efficiently and effectively utilizing VR in present systems.
Key enablers propelling the global VR in healthcare market growth:
- Increasing use of VR technology for training purposes
- For a long time, healthcare institutes, academics, and labs have used virtual reality-based instruction.
- VR-based training essentially immerses the trainee in a 3D environment related to the subject matter by using a specially built audio-visual headset. Besides, this strategy is highly beneficial.
- It not only eliminates distractions but also engages trainees in the simulation to a point where they respond to it in the same way they would in a real-life situation.
- Since virtual reality stimulates numerous learning systems in the brain at the same time, it is the perfect tool for healthcare simulation situational awareness training.
- Situational awareness, defined as the ability to understand how information, events, and actions impact current and future situations, is critical in healthcare settings.
- Thus, over the upcoming years, the adoption of VR for training purposes in healthcare is expected to proliferate owing to its many benefits.
- Growth in the number of VR based startups
- Increasing aging population
- Improving spending on healthcare
- Upgradation of technology in healthcare
Key growth restraining factors:
- Shortage of skilled labor and required infrastructure
- There is a scarcity of trained professionals who can perform VR procedures.
- Moreover, the number of medical professionals treating people across the world is low, as well. In this regard, doctors, dentists, oral health practitioners, mental health professionals, and allied health professionals in rural and remote areas are substantially low in terms of per capita.
- Health professionals living in remote areas are not trained and lack the infrastructure for the usage of VR technology. Also, consumers in impoverished or underdeveloped countries cannot afford VR devices or are unaware of the technology.
- Thus, the shortage of skilled labor can act as a major impediment to the growth of the market.
- Data security
Global VR in Healthcare Market | Top Trends
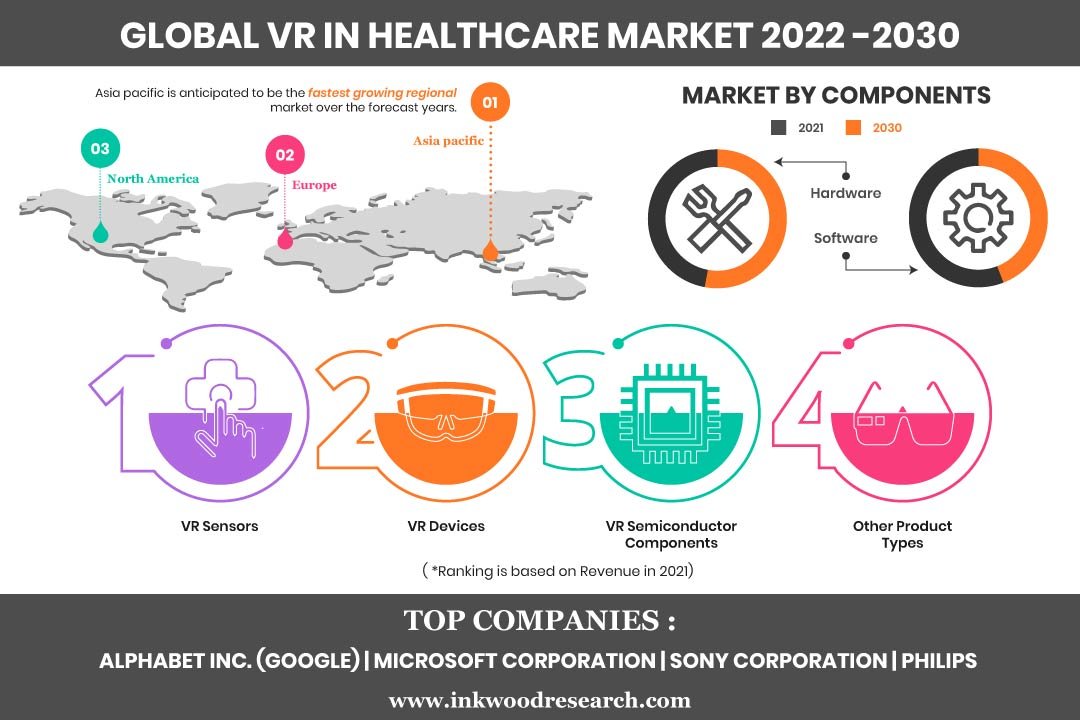
- VR sensors is the fastest-growing product type in the market, progressing at a CAGR of 31.32% during the forecast period.
- Applications in surgical planning are expected to show higher adoption rates.
- The hospitals and clinics segment dominated the end-user category by acquiring a majority share of xx% in 2021.
- The hardware segment, under the component category, captured 68.61% of the share in 2021. The notable growth is attributed to the increase in the number of VR-based hardware for surgeries and rehabilitation, such as sensors, input devices, motion sensors, and head-mounted displays.
Market Segmentation – End-User, Application, Component, Product Type, and Technology –
Market by End-User:
- Hospitals & Clinics
- Research Laboratories
- Others
Market by Application:
- Surgical planning
- Surgical planning captured the largest market share of xx% in 2021. In addition, it is also the fastest-growing application in the global VR in healthcare market.
- VR helps surgeons in the pre-operative planning of surgeries by providing them with an enhanced view of the complex anatomy of the human body and 3D structures.
- With the help of external cameras, a surgeon can virtually walk through the patient’s anatomy to notice intricacies that cannot be observed with conventional imaging. Consequently, a surgeon is able to perform the surgery more precisely in the operating room.
- As a result, the surgical planning segment is set to harbor significant growth opportunities during the forecast period.
- Behavioral Neurology/Rehabilitation
- Pain Management
- Other Applications
Market by Component:
- Hardware
- Software
Market by Product Type:
- VR Semiconductor Components
- VR Devices
- VR Sensors
- Others
Market by Technology:
- Head Mounted
- Gesture Tracking
- The gesture tracking segment is expected to show the fastest growth under the technology category.
- Gesture tracking devices are used to enhance user interaction in the VR environment. Moreover, the technology has also improved the way users interact with objects in the virtual world.
- Gesture tracking technology is different for different devices and is classified into touch device-based input, computer vision interaction device-based input, and wearable-sensor device-based input.
- Furthermore, gesture interaction output display devices in VR include VR glasses, VR helmets, and computer monitors.
- Projectors and Displays
Geographical Study Based on Four Major Regions:
- North America: The United States and Canada
- Europe: The United Kingdom, France, Italy, Belgium, Poland, Germany, and Rest of Europe
- Asia-Pacific: South Korea, Vietnam, China, Japan, India, Thailand, Indonesia, Australia & New Zealand, and Rest of Asia-Pacific
- Asia-Pacific is set to be the fastest-growing region over the forecast period, progressing with a CAGR of 32.10%.
- High-growth nations such as India and China are anticipated to provide the region with lucrative opportunities.
- As a densely populated region, the Asia-Pacific has a significant consumer base for VR in healthcare.
- Hence, these factors are set to augment the VR in healthcare market growth in the Asia-Pacific during the forecasting years.
- Rest of World: Latin America, the Middle East & Africa
Major players in the global VR in healthcare market:
- General Electric
- Alphabet Inc (Google)
- Microsoft Corporation
- Sony Corporation
- Siemens
- Koninklijke Philips NV
Key strategies adopted by some of these companies:
In February 2022, Apollo Hospitals, a major hospital chain in India, collaborated with 8chili Inc to use virtual reality in their healthcare settings. The partnership will enable virtual reality patient counseling and aid in improving patient outcomes.
In April 2021, SyncThink, developer of EYE-SYNC technology, partnered with Tobii, a key player in eye-tracking technology, and Pico Interactive, an innovative VR company.
In April 2021, Varian Medical Systems Inc was purchased by Siemens Healthineers AG. Varian became a new business sector inside Siemens Healthineers, marking a significant step forward in the company’s 2025 strategy, which includes virtual reality applications in cancer treatment.
In January 2021, Capsule Technology Inc, a major developer of medical device integration and data technologies for hospitals and healthcare organizations, was bought by Royal Philips.
Report Synopsis:
| Report Scope | Details |
| Market Forecast Years | 2022-2030 |
| Base Year | 2021 |
| Market Historical Years | 2018-2021 |
| Forecast Units | Revenue ($ Million) |
| Segments Analyzed | End-User, Application, Product Type, Component, and Technology |
| Geographies Analyzed | North America, Europe, Asia-Pacific, and Rest of World |
| Companies Analyzed | SyncThink Inc, Alphabet Inc (Google), Sony Corporation, AppliedVR Inc, Siemens AG, Firsthand Technology Inc, Orca Health, General Electric, Microsoft Corporation, Koninklijke Philips NV |
- RESEARCH SCOPE & METHODOLOGY
- STUDY OBJECTIVES
- SCOPE OF STUDY
- METHODOLOGY
- ASSUMPTIONS & LIMITATIONS
- EXECUTIVE SUMMARY
- MARKET SIZE & ESTIMATES
- MARKET OVERVIEW
- MARKET DYNAMICS
- PARENT MARKET ANALYSIS: VR (VIRTUAL REALITY) MARKET
- KEY DRIVERS
- INCREASING USE OF VR TECHNOLOGY FOR TRAINING PURPOSES
- GROWTH IN THE NUMBER OF VR BASED START-UPS
- INCREASING AGING POPULATION
- IMPROVING SPENDING ON HEALTHCARE
- UPGRADATION OF TECHNOLOGY IN HEALTHCARE
- KEY RESTRAINTS
- SHORTAGE OF SKILLED LABOR AND REQUIRED INFRASTRUCTURE
- DATA SECURITY
- KEY ANALYTICS
- IMPACT OF COVID-19 ON VR IN HEALTHCARE MARKET
- KEY MARKET TRENDS
- PORTER’S FIVE FORCES ANALYSIS
- BUYERS POWER
- SUPPLIERS POWER
- SUBSTITUTION
- NEW ENTRANTS
- INDUSTRY RIVALRY
- OPPORTUNITY MATRIX
- VENDOR LANDSCAPE
- VALUE CHAIN ANALYSIS
- MARKET BY END-USER
- HOSPITALS & CLINICS
- RESEARCH LABORATORIES
- OTHERS
- MARKET BY APPLICATION
- SURGICAL PLANNING
- BEHAVIORAL NEUROLOGY/REHABILITATION
- PAIN MANAGEMENT
- OTHER APPLICATIONS
- MARKET BY COMPONENT
- HARDWARE
- SOFTWARE
- MARKET BY PRODUCT TYPE
- VR SEMICONDUCTOR COMPONENTS
- VR DEVICES
- VR SENSORS
- OTHERS
- MARKET BY TECHNOLOGY
- HEAD MOUNTED
- GESTURE TRACKING
- PROJECTORS AND DISPLAYS
- GEOGRAPHICAL ANALYSIS
- NORTH AMERICA
- MARKET SIZE & ESTIMATES
- KEY GROWTH ENABLERS
- KEY CHALLENGES
- KEY PLAYERS
- COUNTRY ANALYSIS
- UNITED STATES
- CANADA
- EUROPE
- MARKET SIZE & ESTIMATES
- KEY GROWTH ENABLERS
- KEY CHALLENGES
- KEY PLAYERS
- COUNTRY ANALYSIS
- UNITED KINGDOM
- GERMANY
- FRANCE
- ITALY
- BELGIUM
- POLAND
- REST OF EUROPE
- ASIA-PACIFIC
- MARKET SIZE & ESTIMATES
- KEY GROWTH ENABLERS
- KEY CHALLENGES
- KEY PLAYERS
- COUNTRY ANALYSIS
- CHINA
- JAPAN
- INDIA
- SOUTH KOREA
- INDONESIA
- THAILAND
- VIETNAM
- AUSTRALIA & NEW ZEALAND
- REST OF ASIA-PACIFIC
- REST OF WORLD
- MARKET SIZE & ESTIMATES
- KEY GROWTH ENABLERS
- KEY CHALLENGES
- KEY PLAYERS
- REGIONAL ANALYSIS
- LATIN AMERICA
- MIDDLE EAST & AFRICA
- NORTH AMERICA
- COMPETITIVE LANDSCAPE
- KEY STRATEGIC DEVELOPMENTS
- MERGERS & ACQUISITIONS
- PRODUCT LAUNCHES & DEVELOPMENTS
- PARTNERSHIPS & AGREEMENTS
- COMPANY PROFILES
- ALPHABET INC (GOOGLE)
- APPLIEDVR INC
- FIRSTHAND TECHNOLOGY INC
- GENERAL ELECTRIC
- KONINKLIJKE PHILIPS NV
- MICROSOFT CORPORATION
- ORCA HEALTH
- SIEMENS AG
- SONY CORPORATION
- SYNCTHINK INC
- KEY STRATEGIC DEVELOPMENTS
LIST OF TABLES
TABLE 1: MARKET SNAPSHOT – VR IN HEALTHCARE
TABLE 2: GLOBAL VR IN HEALTHCARE MARKET, BY END-USER, HISTORICAL YEARS, 2018-2021 (IN $ MILLION)
TABLE 3: GLOBAL VR IN HEALTHCARE MARKET, BY END-USER, FORECAST YEARS, 2022-2030 (IN $ MILLION)
TABLE 4: GLOBAL HOSPITALS & CLINICS MARKET, BY REGION, HISTORICAL YEARS, 2018-2021 (IN $ MILLION)
TABLE 5: GLOBAL HOSPITALS & CLINICS MARKET, BY REGION, FORECAST YEARS, 2022-2030 (IN $ MILLION)
TABLE 6: GLOBAL RESEARCH LABORATORIES MARKET, BY REGION, HISTORICAL YEARS, 2018-2021 (IN $ MILLION)
TABLE 7: GLOBAL RESEARCH LABORATORIES MARKET, BY REGION, FORECAST YEARS, 2022-2030 (IN $ MILLION)
TABLE 8: GLOBAL OTHERS MARKET, BY REGION, HISTORICAL YEARS, 2018-2021 (IN $ MILLION)
TABLE 9: GLOBAL OTHERS MARKET, BY REGION, FORECAST YEARS, 2022-2030 (IN $ MILLION)
TABLE 10: GLOBAL VR IN HEALTHCARE MARKET, BY APPLICATION, HISTORICAL YEARS, 2018-2021 (IN $ MILLION)
TABLE 11: GLOBAL VR IN HEALTHCARE MARKET, BY APPLICATION, FORECAST YEARS, 2022-2030 (IN $ MILLION)
TABLE 12: GLOBAL SURGICAL PLANNING MARKET, BY REGION, HISTORICAL YEARS, 2018-2021 (IN $ MILLION)
TABLE 13: GLOBAL SURGICAL PLANNING MARKET, BY REGION, FORECAST YEARS, 2022-2030 (IN $ MILLION)
TABLE 14: GLOBAL BEHAVIORAL NEUROLOGY/REHABILITATION MARKET, BY REGION, HISTORICAL YEARS, 2018-2021 (IN $ MILLION)
TABLE 15: GLOBAL BEHAVIORAL NEUROLOGY/REHABILITATION MARKET, BY REGION, FORECAST YEARS, 2022-2030 (IN $ MILLION)
TABLE 16: GLOBAL PAIN MANAGEMENT MARKET, BY REGION, HISTORICAL YEARS, 2018-2021 (IN $ MILLION)
TABLE 17: GLOBAL PAIN MANAGEMENT MARKET, BY REGION, FORECAST YEARS, 2022-2030 (IN $ MILLION)
TABLE 18: GLOBAL OTHER APPLICATIONS MARKET, BY REGION, HISTORICAL YEARS, 2018-2021 (IN $ MILLION)
TABLE 19: GLOBAL OTHER APPLICATIONS MARKET, BY REGION, FORECAST YEARS, 2022-2030 (IN $ MILLION)
TABLE 20: GLOBAL VR IN HEALTHCARE MARKET, BY COMPONENT, HISTORICAL YEARS, 2018-2021 (IN $ MILLION)
TABLE 21: GLOBAL VR IN HEALTHCARE MARKET, BY COMPONENT, FORECAST YEARS, 2022-2030 (IN $ MILLION)
TABLE 22: GLOBAL HARDWARE MARKET, BY REGION, HISTORICAL YEARS, 2018-2021 (IN $ MILLION)
TABLE 23: GLOBAL HARDWARE MARKET, BY REGION, FORECAST YEARS, 2022-2030 (IN $ MILLION)
TABLE 24: GLOBAL SOFTWARE MARKET, BY REGION, HISTORICAL YEARS, 2018-2021 (IN $ MILLION)
TABLE 25: GLOBAL SOFTWARE MARKET, BY REGION, FORECAST YEARS, 2022-2030 (IN $ MILLION)
TABLE 26: GLOBAL VR IN HEALTHCARE MARKET, BY PRODUCT TYPE, HISTORICAL YEARS, 2018-2021 (IN $ MILLION)
TABLE 27: GLOBAL VR IN HEALTHCARE MARKET, BY PRODUCT TYPE, FORECAST YEARS, 2022-2030 (IN $ MILLION)
TABLE 28: GLOBAL VR SEMICONDUCTOR COMPONENTS MARKET, BY REGION, HISTORICAL YEARS, 2018-2021 (IN $ MILLION)
TABLE 29: GLOBAL VR SEMICONDUCTOR COMPONENTS MARKET, BY REGION, FORECAST YEARS, 2022-2030 (IN $ MILLION)
TABLE 30: GLOBAL VR DEVICES MARKET, BY REGION, HISTORICAL YEARS, 2018-2021 (IN $ MILLION)
TABLE 31: GLOBAL VR DEVICES MARKET, BY REGION, FORECAST YEARS, 2022-2030 (IN $ MILLION)
TABLE 32: GLOBAL VR SENSORS MARKET, BY REGION, HISTORICAL YEARS, 2018-2021 (IN $ MILLION)
TABLE 33: GLOBAL VR SENSORS MARKET, BY REGION, FORECAST YEARS, 2022-2030 (IN $ MILLION)
TABLE 34: GLOBAL OTHERS MARKET, BY REGION, HISTORICAL YEARS, 2018-2021 (IN $ MILLION)
TABLE 35: GLOBAL OTHERS MARKET, BY REGION, FORECAST YEARS, 2022-2030 (IN $ MILLION)
TABLE 36: GLOBAL VR IN HEALTHCARE MARKET, BY TECHNOLOGY, HISTORICAL YEARS, 2018-2021 (IN $ MILLION)
TABLE 37: GLOBAL VR IN HEALTHCARE MARKET, BY TECHNOLOGY, FORECAST YEARS, 2022-2030 (IN $ MILLION)
TABLE 38: GLOBAL HEAD MOUNTED MARKET, BY REGION, HISTORICAL YEARS. 2018-2021 (IN $ MILLION)
TABLE 39: GLOBAL HEAD MOUNTED MARKET, BY REGION, FORECAST YEARS, 2022-2030 (IN $ MILLION)
TABLE 40: GLOBAL GESTURE TRACKING MARKET, BY REGION, HISTORICAL YEARS, 2018-2021 (IN $ MILLION)
TABLE 41: GLOBAL GESTURE TRACKING MARKET, BY REGION, FORECAST YEARS, 2022-2030 (IN $ MILLION)
TABLE 42: GLOBAL PROJECTORS AND DISPLAYS MARKET, BY REGION, HISTORICAL YEARS, 2018-2021 (IN $ MILLION)
TABLE 43: GLOBAL PROJECTORS AND DISPLAYS MARKET, BY REGION, FORECAST YEARS, 2022-2030 (IN $ MILLION)
TABLE 44: GLOBAL VR IN HEALTHCARE MARKET, BY GEOGRAPHY, HISTORICAL YEARS, 2018-2021 (IN $ MILLION)
TABLE 45: GLOBAL VR IN HEALTHCARE MARKET, BY GEOGRAPHY, FORECAST YEARS, 2022-2030 (IN $ MILLION)
TABLE 46: NORTH AMERICA VR IN HEALTHCARE MARKET, BY COUNTRY, HISTORICAL YEARS, 2018-2021 (IN $ MILLION)
TABLE 47: NORTH AMERICA VR IN HEALTHCARE MARKET, BY COUNTRY, FORECAST YEARS, 2022-2030 (IN $ MILLION)
TABLE 48: LEADING PLAYERS OPERATING IN NORTH AMERICA VR IN HEALTHCARE MARKET
TABLE 49: EUROPE VR IN HEALTHCARE MARKET, BY COUNTRY, HISTORICAL YEARS, 2018-2021 (IN $ MILLION)
TABLE 50: EUROPE VR IN HEALTHCARE MARKET, BY COUNTRY, FORECAST YEARS, 2022-2030 (IN $ MILLION)
TABLE 51: LEADING PLAYERS OPERATING IN EUROPE VR IN HEALTHCARE MARKET
TABLE 52: ASIA-PACIFIC VR IN HEALTHCARE MARKET, BY COUNTRY, HISTORICAL YEARS, 2018-2021 (IN $ MILLION)
TABLE 53: ASIA-PACIFIC VR IN HEALTHCARE MARKET, BY COUNTRY, FORECAST YEARS, 2022-2030 (IN $ MILLION)
TABLE 54: LEADING PLAYERS OPERATING IN ASIA-PACIFIC VR IN HEALTHCARE MARKET
TABLE 55: REST OF WORLD VR IN HEALTHCARE MARKET, BY REGION, HISTORICAL YEARS, 2018-2021 (IN $ MILLION)
TABLE 56: REST OF WORLD VR IN HEALTHCARE MARKET, BY REGION, FORECAST YEARS, 2022-2030 (IN $ MILLION)
TABLE 57: LEADING PLAYERS OPERATING IN REST OF WORLD VR IN HEALTHCARE MARKET
TABLE 58: LIST OF MERGERS & ACQUISITIONS
TABLE 59: LIST OF PRODUCT LAUNCHES & DEVELOPMENTS
TABLE 60: LIST OF PARTNERSHIPS & AGREEMENTS
LIST OF FIGURES
FIGURE 1: KEY MARKET TRENDS
FIGURE 2: PORTER’S FIVE FORCES ANALYSIS
FIGURE 3: OPPORTUNITY MATRIX
FIGURE 4: VENDOR LANDSCAPE
FIGURE 5: VALUE CHAIN ANALYSIS
FIGURE 6: GLOBAL VR IN HEALTHCARE MARKET, GROWTH POTENTIAL, BY END-USER, IN 2021
FIGURE 7: GLOBAL VR IN HEALTHCARE MARKET, BY HOSPITALS & CLINICS, 2022-2030 (IN $ MILLION)
FIGURE 8: GLOBAL VR IN HEALTHCARE MARKET, BY RESEARCH LABORATORIES, 2022-2030 (IN $ MILLION)
FIGURE 9: GLOBAL VR IN HEALTHCARE MARKET, BY OTHERS, 2022-2030 (IN $ MILLION)
FIGURE 10: GLOBAL VR IN HEALTHCARE MARKET, GROWTH POTENTIAL, BY APPLICATION, IN 2021
FIGURE 11: GLOBAL VR IN HEALTHCARE MARKET, BY SURGICAL PLANNING, 2022-2030 (IN $ MILLION)
FIGURE 12: GLOBAL VR IN HEALTHCARE MARKET, BY BEHAVIORAL NEUROLOGY/REHABILITATION, 2022-2030 (IN $ MILLION)
FIGURE 13: GLOBAL VR IN HEALTHCARE MARKET, BY PAIN MANAGEMENT, 2022-2030 (IN $ MILLION)
FIGURE 14: GLOBAL VR IN HEALTHCARE MARKET, BY OTHER APPLICATIONS, 2022-2030 (IN $ MILLION)
FIGURE 15: GLOBAL VR IN HEALTHCARE MARKET, GROWTH POTENTIAL, BY COMPONENT, IN 2021
FIGURE 16: GLOBAL VR IN HEALTHCARE MARKET, BY HARDWARE, 2022-2030 (IN $ MILLION)
FIGURE 17: GLOBAL VR IN HEALTHCARE MARKET, BY SOFTWARE, 2022-2030 (IN $ MILLION)
FIGURE 18: GLOBAL VR IN HEALTHCARE MARKET, GROWTH POTENTIAL, BY PRODUCT TYPE, IN 2021
FIGURE 19: GLOBAL VR IN HEALTHCARE MARKET, BY VR SEMICONDUCTOR COMPONENTS, 2022-2030 (IN $ MILLION)
FIGURE 20: GLOBAL VR IN HEALTHCARE MARKET, BY VR DEVICES, 2022-2030 (IN $ MILLION)
FIGURE 21: GLOBAL VR IN HEALTHCARE MARKET, BY VR SENSORS, 2022-2030 (IN $ MILLION)
FIGURE 22: GLOBAL VR IN HEALTHCARE MARKET, BY OTHERS, 2022-2030 (IN $ MILLION)
FIGURE 23: GLOBAL VR IN HEALTHCARE MARKET, GROWTH POTENTIAL, BY TECHNOLOGY, IN 2021
FIGURE 24: GLOBAL VR IN HEALTHCARE MARKET, BY HEAD MOUNTED, 2022-2030 (IN $ MILLION)
FIGURE 25: GLOBAL VR IN HEALTHCARE MARKET, BY GESTURE TRACKING, 2022-2030 (IN $ MILLION)
FIGURE 26: GLOBAL VR IN HEALTHCARE MARKET, BY PROJECTORS AND DISPLAYS, 2022-2030 (IN $ MILLION)
FIGURE 27: NORTH AMERICA VR IN HEALTHCARE MARKET, COUNTRY OUTLOOK, 2021 & 2030 (IN %)
FIGURE 28: UNITED STATES VR IN HEALTHCARE MARKET, 2022-2030 (IN $ MILLION)
FIGURE 29: CANADA VR IN HEALTHCARE MARKET, 2022-2030 (IN $ MILLION)
FIGURE 30: EUROPE VR IN HEALTHCARE MARKET, COUNTRY OUTLOOK, 2021 & 2030 (IN %)
FIGURE 31: UNITED KINGDOM VR IN HEALTHCARE MARKET, 2022-2030 (IN $ MILLION)
FIGURE 32: GERMANY VR IN HEALTHCARE MARKET, 2022-2030 (IN $ MILLION)
FIGURE 33: FRANCE VR IN HEALTHCARE MARKET, 2022-2030 (IN $ MILLION)
FIGURE 34: ITALY VR IN HEALTHCARE MARKET, 2022-2030 (IN $ MILLION)
FIGURE 35: BELGIUM VR IN HEALTHCARE MARKET, 2022-2030 (IN $ MILLION)
FIGURE 36: POLAND VR IN HEALTHCARE MARKET, 2022-2030 (IN $ MILLION)
FIGURE 37: REST OF EUROPE VR IN HEALTHCARE MARKET, 2022-2030 (IN $ MILLION)
FIGURE 38: ASIA-PACIFIC VR IN HEALTHCARE MARKET, COUNTRY OUTLOOK, 2021 & 2030 (IN %)
FIGURE 39: CHINA VR IN HEALTHCARE MARKET, 2022-2030 (IN $ MILLION)
FIGURE 40: JAPAN VR IN HEALTHCARE MARKET, 2022-2030 (IN $ MILLION)
FIGURE 41: INDIA VR IN HEALTHCARE MARKET, 2022-2030 (IN $ MILLION)
FIGURE 42: SOUTH KOREA VR IN HEALTHCARE MARKET, 2022-2030 (IN $ MILLION)
FIGURE 43: INDONESIA VR IN HEALTHCARE MARKET, 2022-2030 (IN $ MILLION)
FIGURE 44: THAILAND VR IN HEALTHCARE MARKET, 2022-2030 (IN $ MILLION)
FIGURE 45: VIETNAM VR IN HEALTHCARE MARKET, 2022-2030 (IN $ MILLION)
FIGURE 46: AUSTRALIA & NEW ZEALAND VR IN HEALTHCARE MARKET, 2022-2030 (IN $ MILLION)
FIGURE 47: REST OF ASIA-PACIFIC VR IN HEALTHCARE MARKET, 2022-2030 (IN $ MILLION)
FIGURE 48: REST OF WORLD VR IN HEALTHCARE MARKET, REGIONAL OUTLOOK, 2021 & 2030 (IN %)
FIGURE 49: LATIN AMERICA VR IN HEALTHCARE MARKET, 2022-2030 (IN $ MILLION)
FIGURE 50: MIDDLE EAST & AFRICA VR IN HEALTHCARE MARKET, 2022-2030 (IN $ MILLION)
- MARKET BY END-USER
- HOSPITALS & CLINICS
- RESEARCH LABORATORIES
- OTHERS
- MARKET BY APPLICATION
- SURGICAL PLANNING
- BEHAVIORAL NEUROLOGY/REHABILITATION
- PAIN MANAGEMENT
- OTHER APPLICATIONS
- MARKET BY COMPONENT
- HARDWARE
- SOFTWARE
- MARKET BY PRODUCT TYPE
- VR SEMICONDUCTOR COMPONENTS
- VR DEVICES
- VR SENSORS
- OTHERS
- MARKET BY TECHNOLOGY
- HEAD MOUNTED
- GESTURE TRACKING
- PROJECTORS AND DISPLAYS
- GEOGRAPHICAL ANALYSIS
- NORTH AMERICA
- MARKET SIZE & ESTIMATES
- KEY GROWTH ENABLERS
- KEY CHALLENGES
- KEY PLAYERS
- COUNTRY ANALYSIS
- UNITED STATES
- CANADA
- EUROPE
- MARKET SIZE & ESTIMATES
- KEY GROWTH ENABLERS
- KEY CHALLENGES
- KEY PLAYERS
- COUNTRY ANALYSIS
- UNITED KINGDOM
- GERMANY
- FRANCE
- ITALY
- BELGIUM
- POLAND
- REST OF EUROPE
- ASIA-PACIFIC
- MARKET SIZE & ESTIMATES
- KEY GROWTH ENABLERS
- KEY CHALLENGES
- KEY PLAYERS
- COUNTRY ANALYSIS
- CHINA
- JAPAN
- INDIA
- SOUTH KOREA
- INDONESIA
- THAILAND
- VIETNAM
- AUSTRALIA & NEW ZEALAND
- REST OF ASIA-PACIFIC
- REST OF WORLD
- MARKET SIZE & ESTIMATES
- KEY GROWTH ENABLERS
- KEY CHALLENGES
- KEY PLAYERS
- REGIONAL ANALYSIS
- LATIN AMERICA
- MIDDLE EAST & AFRICA
- NORTH AMERICA
To request a free sample copy of this report, please complete the form below :
We offer 10% free customization including country-level data, niche applications and competitive landscape with every report.
Frequently Asked Questions & Answers (FAQs):
What is the market size of global VR in healthcare market?
The global VR in healthcare market was valued at $448.49 million in 2021.
Which is the fastest-growing product type in the global VR in healthcare market?
VR sensors are the fastest-growing product type in the global VR in healthcare market.
Which is the leading end-user in the global VR in healthcare market?
Hospitals and clinics are the leading end-user in the global VR in healthcare market.
To request a free sample copy of this report, please complete the form below:
We offer 10% free customization including country-level data, niche applications and competitive landscape with every report.