
GLOBAL ENERGY HARVESTING MARKET FORECAST 2020-2028
Global Energy Harvesting Market by Source (Light, Mechanical, Electromagnetic/rf, Thermal, Others) by System (Electrodynamic, Photovoltaic, Thermoelectric, Piezoelectric, Rf Transducers, Electromagnetic Transducers) by Application (Building and Home Automation, Consumer Electronics, Industrial Application, Transportation, Security & Defense) by Geography.
Inkwood Research estimates that the global market for energy harvesting is estimated to record a CAGR of 10.07% during the forecast period & will reach revenue of $987.09 million by 2028. The base year considered for the market study is 2019, and the forecasted period is between 2020 & 2028.
The global energy harvesting market growth is driven by:
- Growth of smart cities fuels the growth of sensors
- Technology advancement in manufacturing industries
- IoT implementation for building automation
To know more about this report, request a free sample copy.
The rising implementation of IoT for building automation is another major factor driving the global energy harvesting market. The global building automation industry is growing rapidly. IoT is providing a large range of benefits in the industry, and hence there can be seen in extensive implementations of IoT for building automation. The use of energy harvesting for building automation has strong potential to cut down the overall building’s energy cost. This shifts the argument from utilizing different renewable energy sources to the reduction in the overall consumption of energy. The government and non-government organizations are putting great stress on the reduction of energy consumption, such as The United Kingdom National Energy Efficiency Action Plan, which includes striving goals of reducing the primary energy consumption by up to 20% by 2020. The target is the large buildings, which consume around 40% of the UK’s primary energy. Building automation is now considered as an integral part of the Building Renovation Strategy in the National Energy Efficiency Plan and is used to control systems such as ventilation, lighting or shading, heating, in accordance with the requirements of the individuals.
The photovoltaic system generates electric power by converting the solar radiation (both outdoor and indoor) into direct current electricity by deploying semiconductors that display the photovoltaic effect. The Photovoltaic power generation system uses solar panels composed of a number of cells consisting of photovoltaic material. This system has gained popularity owing to its numerous advantages like long lifespan and declining overall cost. Recently, the PV systems have witnessed a dramatic decrease bringing the overall cost to approx — $ 1-$1.3 per PV watt installed (complete PV deployment cost). However, its limited efficiency level is acting as a barrier but only to a limited extent. This system finds its major application in the marine, military & aerospace, and consumer industry. U.S. and China are regarded as the leading manufacturers of photovoltaic systems (solar panels). Piezoelectric was the leading segment in terms of revenue in the global energy harvesting market at CAGR of 15.18% in 2019. Piezoelectric systems/transducer works on the principle of the piezoelectric effect. Piezoelectric systems possess the capability of converting mechanical strain into a voltage or electric current. One of the finest examples of the energy harvesting system by deploying a piezoelectric transducer is represented by the East Japan Railway Company (JR East). The company installed the piezoelectric materials at the gate area of tickets, generating electricity by the vibrations created by the passengers passing through the ticket gates.
On the other hand, the global energy harvesting market growth is restricted by high initial costs for deployment of EHS, low adoption in developing countries due to high prices, lack of awareness about energy. Countries with a high population and high consumption of energy, such as South Korea, Indonesia, and Brazil, are still lacking high utilization of this technology due to a lack of awareness among the consumers. These countries still rely upon the high use of conventional fossil-based fuels such as coal and petroleum.The government can be a great help in awareness of related challenges for this sector. The term energy harvesting also is not widely used in studies like engineering, energy sciences, and others. As major projects of the energy harvesting sector are under the pipeline, there is comparatively less share in the market for such products, and thus less information is available to the general public.
The report on the global energy harvesting market includes segmentation analysis on the basis of source, system, and application.
Market by Source:
- Light
- Solar
- Infrared
- UV
- Mechanical
- Pressure
- Vibration
- Electromagnetic/RF
- Near Field
- Far-field
- Thermal
- Others
Market by System:
- Electrodynamic
- Photovoltaic
- Thermoelectric
- Piezoelectric
- RF Transducers
- Electromagnetic Transducers
Market by Application:
- Building and Home Automation
- Consumer Electronics
- Industrial application
- Transportation
- Security & defense
Geographically, the global energy harvesting market has been segmented on the basis of four major regions, which includes:
- North America: the United States and Canada
- Asia Pacific: Thailand, Vietnam, Australia, New Zealand, China, Japan, India, South Korea, Indonesia, and the Rest of Asia Pacific
- Europe: Russia, Belgium, Poland, the United Kingdom, Germany, France, Italy, and the Rest of Europe
- Rest of World: Latin America, the Middle East & Africa
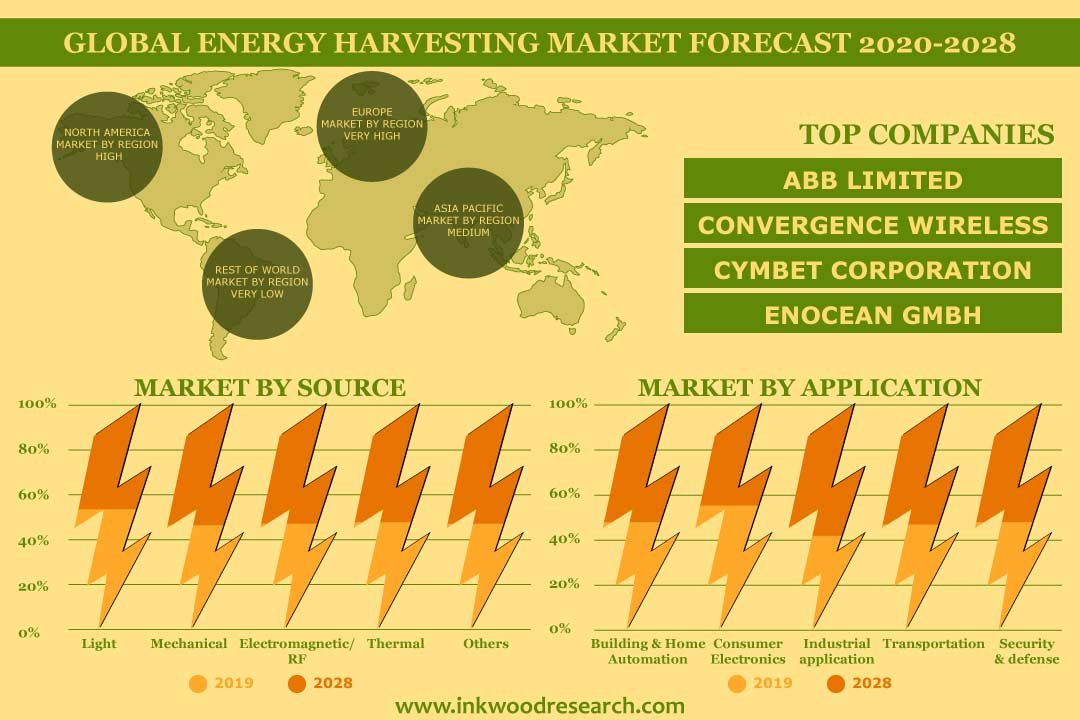
In terms of geography, Europe is the largest market with a market share of 39.85% in terms of revenue in 2019. The dominance of Europe is attributed to the government initiatives taken in the region. The European Union is trying to achieve its energy and climate targets. Achieving the targets would mean EU to decarbonize its existing energy and creating an efficient energy supply. At present, around three-fourths of total energy production in Europe is from fossil fuels. A lot of work needs to be done by the EU nation-states in order to transform the existing energy sector. Tapping into renewable energy sources and harvesting energy are some of the ways Europe is trying to achieve the target. The Asia Pacific, on the other hand, is anticipated to be the fastest-growing region with a CAGR of 11.49% during the forecast period. The governments in the region are making efforts in every way to harvest energy. For instance, the Chinese government aimed to reduce energy intensity by a total of 15% between 2016 and 2020. There are foreign investments done with major firms, such as Google Inc., and Microsoft Corporation, investing huge amounts of money in setting up offices across the country, with the implementation of advanced devices and technology. There has been a rise in smart cities in the region, which has helped to harvest huge amounts of energy and manage the energy in the area.
The key industry players in the global harvesting market are:
- ABB Limited,
- Fujitsu Limited
- Honeywell International Inc.
- Microchip Technology
- Schneider Electric
- Others
In October 2019, ABB Ltd, unveiled an energy storage system for e-buses or trolleybuses, railways and, e-trucks at a new production facility in Baden. In August 2019, Schneider Electric launched the Schneider Electric Exchange. It is the world’s cross-industry open ecosystem for solving efficiency challenges and real-world sustainability.
Key findings of the global energy harvesting market:
- Europe leads the global energy harvesting market by capturing the largest market share of around 39.85% in 2019.
- The Asia Pacific energy harvesting market is anticipated to grow at the highest CAGR of 11.49% during the forecast period of 2020-2028.
- Light holds the largest market share by capturing 46.32% in 2019 amongst the source type.
- Piezoelectric is the fastest growing system with a CAGR of 15.18% during the forecast period of 2020-2028.
- RESEARCH SCOPE & METHODOLOGY
- STUDY OBJECTIVES
- SCOPE OF STUDY
- METHODOLOGY
- ASSUMPTIONS & LIMITATIONS
- EXECUTIVE SUMMARY
- MARKET SIZE & ESTIMATES
- MARKET OVERVIEW
- MARKET DYNAMICS
- DEVELOPMENT OF ENERGY HARVESTING
- MARKET DEFINITION
- KEY DRIVERS
- GROWTH OF SMART CITIES FUELS GROWTH OF SENSORS
- TECHNOLOGY ADVANCEMENT IN MANUFACTURING INDUSTRIES
- IOT IMPLEMENTATION FOR BUILDING AUTOMATION
- KEY RESTRAINTS
- HIGH INITIAL COSTS FOR DEPLOYMENT OF EHS
- LOW ADOPTION IN DEVELOPING COUNTRIES DUE TO HIGH PRICES
- LACK OF AWARENESS ABOUT ENERGY HARVESTING
- KEY ANALYTICS
- KEY INVESTMENT INSIGHTS
- PORTER’S FIVE FORCE ANALYSIS
- BUYER POWER
- SUPPLIER POWER
- SUBSTITUTION
- NEW ENTRANTS
- INDUSTRY RIVALRY
- OPPORTUNITY MATRIX
- VENDOR LANDSCAPE
- KEY BUYING CRITERIA
- DEVICE EFFICIENCY
- COST
- VIABILITY
- APPLICATIONS AND EFFECTIVENESS
- MARKET BY SOURCE
- LIGHT
- SOLAR ENERGY
- INFRARED ENERGY
- UV ENERGY
- MECHANICAL
- PRESSURE
- VIBRATION
- ELECTROMAGNETIC/RF
- NEAR FIELD
- FAR FIELD
- THERMAL
- OTHERS
- LIGHT
- MARKET BY SYSTEM
- ELECTRODYNAMIC
- PHOTOVOLTAIC
- THERMOELECTRIC
- PIEZOELECTRIC
- RF TRANSDUCERS
- ELECTROMAGNETIC TRANSDUCERS
- MARKET BY APPLICATION
- BUILDING AND HOME AUTOMATION
- CONSUMER ELECTRONICS
- INDUSTRIAL APPLICATION
- TRANSPORTATION
- SECURITY & DEFENSE
- GEOGRAPHICAL ANALYSIS
- NORTH AMERICA
- UNITED STATES
- CANADA
- EUROPE
- UNITED KINGDOM
- GERMANY
- FRANCE
- ITALY
- RUSSIA
- BELGIUM
- POLAND
- REST OF EUROPE
- ASIA PACIFIC
- CHINA
- JAPAN
- INDIA
- SOUTH KOREA
- INDONESIA
- THAILAND
- VIETNAM
- AUSTRALIA & NEW ZEALAND
- REST OF ASIA PACIFIC
- REST OF WORLD
- LATIN AMERICA
- MIDDLE EAST & AFRICA
- NORTH AMERICA
- COMPANY PROFILES
- ABB LIMITED
- CONVERGENCE WIRELESS
- CYMBET CORPORATION
- ENOCEAN GMBH
- FUJITSU LIMITED
- GREEN TEG
- G24I POWER LTD
- MOUSER ELECTRONICS, INC.
- HONEYWELL INTERNATIONAL INC.
- MICROCHIP TECHNOLOGY
- LAIRD TECHNOLOGY
- SCHNEIDER ELECTRIC
- SIEMENS AG
- STMICROELECTRONICS N.V.
- TEXAS INSTRUMENT INCORPORATED
LIST OF TABLES
TABLE 1: ENERGY HARVESTING MARKET SNAPSHOT
TABLE 2: GLOBAL ENERGY HARVESTING MARKET, BY SOURCE, HISTORICAL YEARS, 2016-2019 (IN $ MILLION)
TABLE 3: GLOBAL ENERGY HARVESTING MARKET, BY SOURCE, FORECAST YEARS, 2020-2028 (IN $ MILLION)
TABLE 4: GLOBAL LIGHT MARKET, BY REGION, HISTORICAL YEARS, 2016-2019 (IN $ MILLION)
TABLE 5: GLOBAL LIGHT MARKET, BY REGION, FORECAST YEARS, 2020-2028 (IN $ MILLION)
TABLE 6: GLOBAL ENERGY HARVESTING MARKET, BY LIGHT, HISTORICAL YEARS, 2016-2019 (IN $ MILLION)
TABLE 7: GLOBAL ENERGY HARVESTING MARKET, BY LIGHT, FORECAST YEARS, 2020-2028 (IN $ MILLION)
TABLE 8: GLOBAL SOLAR ENERGY MARKET, BY REGION, HISTORICAL YEARS, 2016-2019 (IN $ MILLION)
TABLE 9: GLOBAL SOLAR ENERGY MARKET, BY REGION, FORECAST YEARS, 2020-2028 (IN $ MILLION)
TABLE 10: GLOBAL INFRARED MARKET, BY REGION, HISTORICAL YEARS, 2016-2019 (IN $ MILLION)
TABLE 11: GLOBAL INFRARED MARKET, BY REGION, FORECAST YEARS, 2020-2028 (IN $ MILLION)
TABLE 12: GLOBAL UV ENERGY MARKET, BY REGION, HISTORICAL YEARS, 2016-2019 (IN $ MILLION)
TABLE 13: GLOBAL UV ENERGY MARKET, BY REGION, FORECAST YEARS, 2020-2028 (IN $ MILLION)
TABLE 14: GLOBAL MECHANICAL MARKET, BY REGION, HISTORICAL YEARS, 2016-2019 (IN $ MILLION)
TABLE 15: GLOBAL MECHANICAL MARKET, BY REGION, FORECAST YEARS, 2020-2028 (IN $ MILLION)
TABLE 16: GLOBAL ENERGY HARVESTING MARKET, BY MECHANICAL, HISTORICAL YEARS, 2016-2019 (IN $ MILLION)
TABLE 17: GLOBAL ENERGY HARVESTING MARKET, BY MECHANICAL, FORECAST YEARS, 2020-2028 (IN $ MILLION)
TABLE 18: GLOBAL PRESSURE MARKET, BY REGION, HISTORICAL YEARS, 2016-2019 (IN $ MILLION)
TABLE 19: GLOBAL PRESSURE MARKET, BY REGION, FORECAST YEARS, 2020-2028 (IN $ MILLION)
TABLE 20: GLOBAL VIBRATION MARKET, BY REGION, HISTORICAL YEARS, 2016-2019 (IN $ MILLION)
TABLE 21: GLOBAL VIBRATION MARKET, BY REGION, FORECAST YEARS, 2020-2028 (IN $ MILLION)
TABLE 22: GLOBAL ELECTROMAGNETIC/RF MARKET, BY REGION, HISTORICAL YEARS, 2016-2019 (IN $ MILLION)
TABLE 23: GLOBAL ELECTROMAGNETIC/RF MARKET, BY REGION, FORECAST YEARS, 2020-2028 (IN $ MILLION)
TABLE 24: GLOBAL ENERGY HARVESTING MARKET, BY ELECTROMAGNETIC/RF, HISTORICAL YEARS, 2016-2019 (IN $ MILLION)
TABLE 25: GLOBAL ENERGY HARVESTING MARKET, BY ELECTROMAGNETIC/RF, FORECAST YEARS, 2020-2028 (IN $ MILLION)
TABLE 26: GLOBAL NEAR FIELD MARKET, BY REGION, HISTORICAL YEARS, 2016-2019 (IN $ MILLION)
TABLE 27: GLOBAL NEAR FIELD MARKET, BY REGION, FORECAST YEARS, 2020-2028 (IN $ MILLION)
TABLE 28: GLOBAL FAR FIELD MARKET, BY REGION, HISTORICAL YEARS, 2016-2019 (IN $ MILLION)
TABLE 29: GLOBAL FAR FIELD MARKET, BY REGION, FORECAST YEARS, 2020-2028 (IN $ MILLION)
TABLE 30: GLOBAL THERMAL MARKET, BY REGION, HISTORICAL YEARS, 2016-2019 (IN $ MILLION)
TABLE 31: GLOBAL THERMAL MARKET, BY REGION, FORECAST YEARS, 2020-2028 (IN $ MILLION)
TABLE 32: GLOBAL OTHERS MARKET, BY REGION, HISTORICAL YEARS, 2016-2019 (IN $ MILLION)
TABLE 33: GLOBAL OTHERS MARKET, BY REGION, FORECAST YEARS, 2020-2028 (IN $ MILLION)
TABLE 34: GLOBAL ENERGY HARVESTING MARKET, BY SYSTEM, HISTORICAL YEARS, 2016-2019 (IN $ MILLION)
TABLE 35: GLOBAL ENERGY HARVESTING MARKET, BY SYSTEM, FORECAST YEARS, 2020-2028 (IN $ MILLION)
TABLE 36: GLOBAL ELECTRODYNAMIC MARKET, BY REGION, HISTORICAL YEARS, 2016-2019 (IN $ MILLION)
TABLE 37: GLOBAL ELECTRODYNAMIC MARKET, BY REGION, FORECAST YEARS, 2020-2028 (IN $ MILLION)
TABLE 38: PROS AND CONS OF PHOTOVOLTAIC PANELS
TABLE 39: GLIMPSE OF DEPLOYMENT OF PHOTOVOLTAIC SYSTEMS IN APPLICATION SECTORS
TABLE 40: GLOBAL PHOTOVOLTAIC MARKET, BY REGION, HISTORICAL YEARS, 2016-2019 (IN $ MILLION)
TABLE 41: GLOBAL PHOTOVOLTAIC MARKET, BY REGION, FORECAST YEARS, 2020-2028 (IN $ MILLION)
TABLE 42: ADVANTAGES AND DISADVANTAGES OF THERMOELECTRIC TRANSDUCERS/GENERATORS
TABLE 43: GLOBAL THERMOELECTRIC MARKET, BY REGION, HISTORICAL YEARS, 2016-2019 (IN $ MILLION)
TABLE 44: GLOBAL THERMOELECTRIC MARKET, BY REGION, FORECAST YEARS, 2020-2028 (IN $ MILLION)
TABLE 45: ADVANTAGES AND DISADVANTAGES OF PIEZOELECTRIC TRANSDUCERS
TABLE 46: APPLICATIONS OF ENERGY HARVESTING THROUGH PIEZOELECTRIC MATERIAL
TABLE 47: GLOBAL PIEZOELECTRIC MARKET, BY REGION, HISTORICAL YEARS, 2016-2019 (IN $ MILLION)
TABLE 48: GLOBAL PIEZOELECTRIC MARKET, BY REGION, FORECAST YEARS, 2020-2028 (IN $ MILLION)
TABLE 49: GLOBAL RF TRANSDUCERS MARKET, BY REGION, HISTORICAL YEARS, 2016-2019 (IN $ MILLION)
TABLE 50: GLOBAL RF TRANSDUCERS MARKET, BY REGION, FORECAST YEARS, 2020-2028 (IN $ MILLION)
TABLE 51: GLOBAL ELECTROMAGNETIC TRANSDUCERS MARKET, BY REGION, HISTORICAL YEARS, 2016-2019 (IN $ MILLION)
TABLE 52: GLOBAL ELECTROMAGNETIC TRANSDUCERS MARKET, BY REGION, FORECAST YEARS, 2020-2028 (IN $ MILLION)
TABLE 53: GLOBAL ENERGY HARVESTING MARKET, BY APPLICATION, HISTORICAL YEARS, 2016-2019 (IN $ MILLION)
TABLE 54: GLOBAL ENERGY HARVESTING MARKET, BY APPLICATION, FORECAST YEARS, 2020-2028 (IN $ MILLION)
TABLE 55: GLOBAL BUILDING AND HOME AUTOMATION MARKET, BY REGION, HISTORICAL YEARS, 2016-2019 (IN $ MILLION)
TABLE 56: GLOBAL BUILDING AND HOME AUTOMATION MARKET, BY REGION, FORECAST YEARS, 2020-2028 (IN $ MILLION)
TABLE 57: GLOBAL CONSUMER ELECTRONICS MARKET, BY REGION, HISTORICAL YEARS, 2016-2019 (IN $ MILLION)
TABLE 58: GLOBAL CONSUMER ELECTRONICS MARKET, BY REGION, FORECAST YEARS, 2020-2028 (IN $ MILLION)
TABLE 59: GLOBAL INDUSTRIAL APPLICATION MARKET, BY REGION, HISTORICAL YEARS, 2016-2019 (IN $ MILLION)
TABLE 60: GLOBAL INDUSTRIAL APPLICATION MARKET, BY REGION, FORECAST YEARS, 2020-2028 (IN $ MILLION)
TABLE 61: GLOBAL TRANSPORTATION MARKET, BY REGION, HISTORICAL YEARS, 2016-2019 (IN $ MILLION)
TABLE 62: GLOBAL TRANSPORTATION MARKET, BY REGION, FORECAST YEARS, 2020-2028 (IN $ MILLION)
TABLE 63: GLOBAL SECURITY & DEFENSE MARKET, BY REGION, HISTORICAL YEARS, 2016-2019 (IN $ MILLION)
TABLE 64: GLOBAL SECURITY & DEFENSE MARKET, BY REGION, FORECAST YEARS, 2020-2028 (IN $ MILLION)
TABLE 65: GLOBAL ENERGY HARVESTING MARKET, BY GEOGRAPHY, HISTORICAL YEARS, 2016-2019 (IN $ MILLION)
TABLE 66: GLOBAL ENERGY HARVESTING MARKET, BY GEOGRAPHY, FORECAST YEARS, 2020-2028 (IN $ MILLION)
TABLE 67: NORTH AMERICA ENERGY HARVESTING MARKET, BY COUNTRY, HISTORICAL YEARS, 2016-2019 (IN $ MILLION)
TABLE 68: NORTH AMERICA ENERGY HARVESTING MARKET, BY COUNTRY, FORECAST YEARS, 2020-2028 (IN $ MILLION)
TABLE 69: EUROPE ENERGY HARVESTING MARKET, BY COUNTRY, HISTORICAL YEARS, 2016-2019 (IN $ MILLION)
TABLE 70: EUROPE ENERGY HARVESTING MARKET, BY COUNTRY, FORECAST YEARS, 2020-2028 (IN $ MILLION)
TABLE 71: FOUR PATHWAYS FOR ENERGY TRANSITION IN FRANCE
TABLE 72: ASIA PACIFIC ENERGY HARVESTING MARKET, BY COUNTRY, HISTORICAL YEARS, 2016-2019 (IN $ MILLION)
TABLE 73: ASIA PACIFIC ENERGY HARVESTING MARKET, BY COUNTRY, FORECAST YEARS, 2020-2028 (IN $ MILLION)
TABLE 74: REST OF WORLD ENERGY HARVESTING MARKET, BY REGION, HISTORICAL YEARS, 2016-2019 (IN $ MILLION)
TABLE 75: REST OF WORLD ENERGY HARVESTING MARKET, BY REGION, FORECAST YEARS, 2020-2028 (IN $ MILLION)
LIST OF FIGURES
FIGURE 1: KEY INVESTMENT INSIGHTS
FIGURE 2: PORTER’S FIVE FORCE ANALYSIS
FIGURE 3: OPPORTUNITY MATRIX
FIGURE 4: VENDOR LANDSCAPE
FIGURE 5: KEY BUYING CRITERIA
FIGURE 6: GLOBAL ENERGY HARVESTING MARKET, GROWTH POTENTIAL, BY SOURCE, IN 2019
FIGURE 7: GLOBAL ENERGY HARVESTING MARKET, BY LIGHT, 2020-2028 (IN $ MILLION)
FIGURE 8: GLOBAL ENERGY HARVESTING MARKET, BY SOLAR ENERGY, 2020-2028 (IN $ MILLION)
FIGURE 9: GLOBAL ENERGY HARVESTING MARKET, BY INFRARED, 2020-2028 (IN $ MILLION)
FIGURE 10: GLOBAL ENERGY HARVESTING MARKET, BY UV ENERGY, 2020-2028 (IN $ MILLION)
FIGURE 11: GLOBAL ENERGY HARVESTING MARKET, BY MECHANICAL, 2020-2028 (IN $ MILLION)
FIGURE 12: GLOBAL ENERGY HARVESTING MARKET, BY PRESSURE, 2020-2028 (IN $ MILLION)
FIGURE 13: GLOBAL ENERGY HARVESTING MARKET, BY VIBRATION, 2020-2028 (IN $ MILLION)
FIGURE 14: GLOBAL ENERGY HARVESTING MARKET, BY ELECTROMAGNETIC/RF, 2020-2028 (IN $ MILLION)
FIGURE 15: GLOBAL ENERGY HARVESTING MARKET, BY NEAR FIELD, 2020-2028 (IN $ MILLION)
FIGURE 16: GLOBAL ENERGY HARVESTING MARKET, BY FAR FIELD, 2020-2028 (IN $ MILLION)
FIGURE 17: GLOBAL ENERGY HARVESTING MARKET, BY THERMAL, 2020-2028 (IN $ MILLION)
FIGURE 18: GLOBAL ENERGY HARVESTING MARKET, BY OTHERS, 2020-2028 (IN $ MILLION)
FIGURE 19: GLOBAL ENERGY HARVESTING MARKET, GROWTH POTENTIAL, BY SYSTEM, IN 2019
FIGURE 20: GLOBAL ENERGY HARVESTING MARKET, BY ELECTRODYNAMIC, 2020-2028 (IN $ MILLION)
FIGURE 21: GLOBAL ENERGY HARVESTING MARKET, BY PHOTOVOLTAIC, 2020-2028 (IN $ MILLION)
FIGURE 22: GLOBAL ENERGY HARVESTING MARKET, BY THERMOELECTRIC, 2020-2028 (IN $ MILLION)
FIGURE 23: GLOBAL ENERGY HARVESTING MARKET, BY PIEZOELECTRIC, 2020-2028 (IN $ MILLION)
FIGURE 24: GLOBAL ENERGY HARVESTING MARKET, BY RF TRANSDUCERS, 2020-2028 (IN $ MILLION)
FIGURE 25: GLOBAL ENERGY HARVESTING MARKET, BY ELECTROMAGNETIC TRANSDUCERS, 2020-2028 (IN $ MILLION)
FIGURE 26: GLOBAL ENERGY HARVESTING MARKET, GROWTH POTENTIAL, BY APPLICATION, IN 2019
FIGURE 27: GLOBAL ENERGY HARVESTING MARKET, BY BUILDING AND HOME AUTOMATION, 2020-2028 (IN $ MILLION)
FIGURE 28: GLOBAL ENERGY HARVESTING MARKET, BY CONSUMER ELECTRONICS, 2020-2028 (IN $ MILLION)
FIGURE 29: GLOBAL ENERGY HARVESTING MARKET, BY INDUSTRIAL APPLICATION, 2020-2028 (IN $ MILLION)
FIGURE 30: GLOBAL ENERGY HARVESTING MARKET, BY TRANSPORTATION, 2020-2028 (IN $ MILLION)
FIGURE 31: GLOBAL ENERGY HARVESTING MARKET, BY SECURITY & DEFENSE, 2020-2028 (IN $ MILLION)
FIGURE 32: NORTH AMERICA ENERGY HARVESTING MARKET, REGIONAL OUTLOOK, 2019 & 2028 (IN %)
FIGURE 33: UNITED STATES ENERGY HARVESTING MARKET, 2020-2028 (IN $ MILLION)
FIGURE 34: CANADA ENERGY HARVESTING MARKET, 2020-2028 (IN $ MILLION)
FIGURE 35: EUROPE ENERGY HARVESTING MARKET, REGIONAL OUTLOOK, 2019 & 2028 (IN %)
FIGURE 36: UNITED KINGDOM ENERGY HARVESTING MARKET, 2020-2028 (IN $ MILLION)
FIGURE 37: GERMANY ENERGY HARVESTING MARKET, 2020-2028 (IN $ MILLION)
FIGURE 38: FRANCE ENERGY HARVESTING MARKET, 2020-2028 (IN $ MILLION)
FIGURE 39: ITALY ENERGY HARVESTING MARKET, 2020-2028 (IN $ MILLION)
FIGURE 40: RUSSIA ENERGY HARVESTING MARKET, 2020-2028 (IN $ MILLION)
FIGURE 41: BELGIUM ENERGY HARVESTING MARKET, 2020-2028 (IN $ MILLION)
FIGURE 42: POLAND ENERGY HARVESTING MARKET, 2020-2028 (IN $ MILLION)
FIGURE 43: REST OF EUROPE ENERGY HARVESTING MARKET, 2020-2028 (IN $ MILLION)
FIGURE 44: ASIA PACIFIC ENERGY HARVESTING MARKET, REGIONAL OUTLOOK, 2019 & 2028 (IN %)
FIGURE 45: CHINA ENERGY HARVESTING MARKET, 2020-2028 (IN $ MILLION)
FIGURE 46: JAPAN ENERGY HARVESTING MARKET, 2020-2028 (IN $ MILLION)
FIGURE 47: INDIA ENERGY HARVESTING MARKET, 2020-2028 (IN $ MILLION)
FIGURE 48: SOUTH KOREA ENERGY HARVESTING MARKET, 2020-2028 (IN $ MILLION)
FIGURE 49: INDONESIA ENERGY HARVESTING MARKET, 2020-2028 (IN $ MILLION)
FIGURE 50: THAILAND ENERGY HARVESTING MARKET, 2020-2028 (IN $ MILLION)
FIGURE 51: VIETNAM ENERGY HARVESTING MARKET, 2020-2028 (IN $ MILLION)
FIGURE 52: AUSTRALIA & NEW ZEALAND ENERGY HARVESTING MARKET, 2020-2028 (IN $ MILLION)
FIGURE 53: REST OF ASIA PACIFIC ENERGY HARVESTING MARKET, 2020-2028 (IN $ MILLION)
FIGURE 54: REST OF WORLD ENERGY HARVESTING MARKET, REGIONAL OUTLOOK, 2019 & 2028 (IN %)
FIGURE 55: LATIN AMERICA ENERGY HARVESTING MARKET, 2020-2028 (IN $ MILLION)
FIGURE 56: MIDDLE EAST & AFRICA ENERGY HARVESTING MARKET, 2020-2028 (IN $ MILLION)
- MARKET BY SOURCE
- LIGHT
- SOLAR ENERGY
- INFRARED ENERGY
- UV ENERGY
- MECHANICAL
- PRESSURE
- VIBRATION
- ELECTROMAGNETIC/RF
- NEAR FIELD
- FAR FIELD
- THERMAL
- OTHERS
- LIGHT
- MARKET BY SYSTEM
- ELECTRODYNAMIC
- PHOTOVOLTAIC
- THERMOELECTRIC
- PIEZOELECTRIC
- RF TRANSDUCERS
- ELECTROMAGNETIC TRANSDUCERS
- MARKET BY APPLICATION
- BUILDING AND HOME AUTOMATION
- CONSUMER ELECTRONICS
- INDUSTRIAL APPLICATION
- TRANSPORTATION
- SECURITY & DEFENSE
- GEOGRAPHICAL ANALYSIS
- NORTH AMERICA
- UNITED STATES
- CANADA
- EUROPE
- UNITED KINGDOM
- GERMANY
- FRANCE
- ITALY
- RUSSIA
- BELGIUM
- POLAND
- REST OF EUROPE
- ASIA PACIFIC
- CHINA
- JAPAN
- INDIA
- SOUTH KOREA
- INDONESIA
- THAILAND
- VIETNAM
- AUSTRALIA & NEW ZEALAND
- REST OF ASIA PACIFIC
- REST OF WORLD
- LATIN AMERICA
- MIDDLE EAST & AFRICA
- NORTH AMERICA
To request a free sample copy of this report, please complete the form below :
We offer 10% free customization including country-level data, niche applications and competitive landscape with every report.