
GLOBAL CRUDE OIL MARKET FORECAST 2018-2026
Global Crude Oil Market Is Segmented by Type (Heavy Crude Oil, Light Crude Oil) by Application (Gasoline, Diesel Fuel & Heating Oil, Jet Fuel, Lpg, Liquid Asphalt, Other Application) & by Geography
Crude oil refers to the unrefined petroleum (naturally occurring hydrocarbons). Crude oil is a non-renewable source of energy obtained from drilling earth and is found alongside natural gas and saline water. Through the process of fractional distillation, crude oil is refined and processed to obtain diesel, petrol, kerosene and other petroleum products that have myriad of applications; ranging from acting as a fuel in combustion engines to a raw material for plastics manufacturing.
The global crude oil market was valued at $1618.81 billion in 2017 & is estimated to generate net revenue of approximately $2141.26 billion by 2026, growing at a CAGR of 3.18%. The base year considered for the market study is 2017 and the forecasted period is between 2018-2026. Several factors aiding to the market growth are:
- Booming transportation industry
- The rise in import & export of crude oil
- Rising demand for petroleum products
- Growing demand for fertilizers and petrochemicals in the agriculture sector
- Increased number of active oil rigs across several geographies
To learn more about this report, request a free sample copy
However, the market for crude oil is primarily driven by rising transportation sector. Growing transportation sector globally is the key factor driving adoption of crude oil products such as petrol, diesel, kerosene, liquefied petroleum gas (LPG), jet fuels, etc. Growing vehicle sales across the globe are increasing the demand for petroleum products, which in turn is boosting the growth of crude oil market.
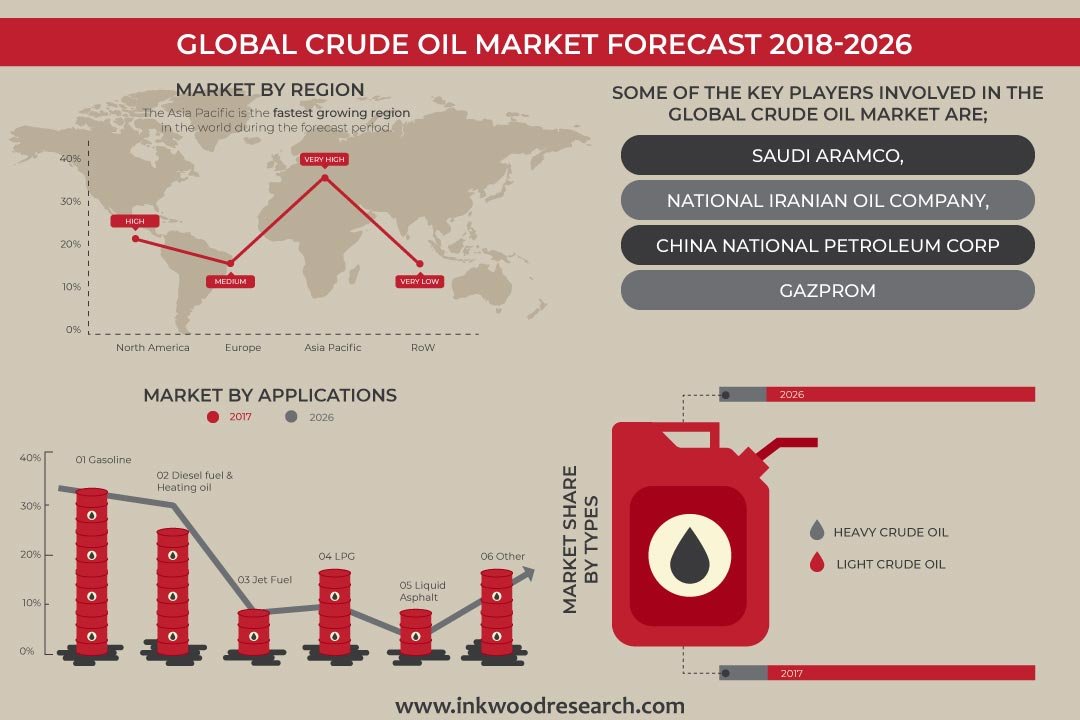
In 2017, Gasoline dominated the application segment of global crude oil market by capturing the largest market share of over XX% along with an estimated revenue of approximately $XX billion. Rising automobile sales globally is expected to be a key driver for augmenting the demand for gasoline since it acts as one of the primary fuel for the automobiles. According to the International Organization of Motor Vehicle Manufacturers (OICA), the overall automobile sales were recorded at about XX million in 2017, approximately by XX% rise as compared to approximately XX million of the total automobile sales recorded globally in 2016. Hence, these growing automobile sales are expected to boost the global gasoline market. The increased sales of the gasoline-powered vehicle across the regions is also expected to drive the crude oil market over the forecast period. On the other hand, the LPG segment is expected to have the fastest CAGR of XX% during the forecast period. According to World LPG Association (WLPGA), domestic use of LPG accounted for XX% of the global consumption of LPG in 2015. This high percentage can be attributed to the high use of LPG as fuel in cooking equipment and heating appliances. The consumption is expected to increase in line with the increasing population globally, as the demand for cooking fuel is also expected to increase with an increase in the population.
Though the Global Crude Oil market has numerous growth drivers, the market growth is curtailed by certain challenges. Key factors restraining the growth of global crude oil market are- fluctuations in crude oil prices & adverse impact of seasonal changes on the demand and supply of the crude oil. Another major challenge in the market is Geo-political issues. The rise in the territorial and regional disputes among different nations is expected to hinder the market growth in the coming years.
The Global Crude Oil Market has been segmented on the basis of Crude Oil Type & Applications. Their further segmentation is as follows:
Market by Type:
- Heavy crude oil
- Light crude oil
Market by Application:
- Gasoline
- Diesel fuel& heating oil
- Jet fuel
- LPG
- Asphalt
- Other Applications
The report scope is restricted to revenues generated from unit sales of crude oil and does not include revenues generated from the transportation of crude oil. The total market revenue is calculated based on the net consumption of crude oil globally.
On the basis of geography, the market for crude oil has been segmented into 4 major regions, as follows;
- Crude Oil North America Market: United States & Canada
- Crude Oil Europe Market: United Kingdom, Germany, France, Spain, Russia & Rest of Europe.
- Crude Oil Asia Pacific Market: China, Japan, India, Indonesia, & Rest of Asia Pacific
- Rest of World: Latin America, Middle East & Africa
Geographically, Asia Pacific accounts for the largest share in the crude oil market. It captured the largest market share in terms of revenue of around XX% and a revenue of approximately $XX billion in 2017. The Asia-Pacific crude oil market is expected to be on up surging trend owing to rising imports of crude oil, growing vehicle sales, rising plastics production in China and strategic alliance between countries to promote oil exploration activities in India. As per the Organization of Petroleum Exporting Countries, as of 2016, the total imports of crude oil in the region accounted for around XX thousand barrels/day earlier; which was around XX thousand barrels/day in 2015. This shows the rising imports of crude oils. This import is primarily due to increasing vehicle sales and the well–established plastics industry.
Moreover, the Middle East region is expected to provide lucrative growth opportunities over the projected years. The countries in the Middle Eastern region are major oil exporting nations across the globe. As per the Organization of Petroleum Exporting Countries, in 2016, around XX% of global oil reserves were in the Middle Eastern region. In 2016, Venezuela stood first for OPEC proven crude oil reserves; accounting for XX%, followed by Saudi Arabia which accounted for XX% of the OPEC total crude oil reserves. High consumption of oil for electricity production act as a primary driver for the growth of crude oil market in the Middle East region. As per the U.S. Energy Information Administration in 2017, XX% of the total electricity production in the Middle East is met through fossil fuels. Oil accounts for XX% of the total electricity production in the Middle East.
The global crude oil market has been segmented on the basis of type and application. Market by type comprises of heavy crude oil & light crude oil. Market by application is further segmented into gasoline, diesel fuel & heating oil, jet fuel, LPG (Liquefied Petroleum Gas), asphalt and others (chemicals such as ethylene, benzene and propylene).
Some of the key players involved in the global crude oil market are;
- Saudi Aramco,
- National Iranian Oil Company,
- China National Petroleum Corporation,
- Gazprom,
- Exxon Mobil
- Other Companies.
Market share analysis along with Company profiles of the key market players are discussed in detail. Collaboration, partnerships, acquisitions, and product launch, are some of the key strategies followed by companies within the crude oil market. For instance, in May 2018, Royal Dutch Shell entered into a joint venture with the China National Offshore Oil Corporation (CNOOC) for the production of its new petrochemical units in China. In April 2018, Marathon Petroleum Corporation signed a merger agreement with Endeavour to acquire all of ANDV’s outstanding shares, representing a total equity value of $23.3 billion and a total enterprise value of $35.6 billion. Furthermore, in March 2018, National Iranian Oil Co. drilled new wells in its Azar oil fields and is expected to increase the production to 65,000 b/d by the end of 2018. It currently stands at 30,000 b/d.
Key Findings of Crude Oil Market are as follows;
- Asia Pacific leads the global crude oil market by capturing the largest market share of over XX% in 2017.
- Although the world observed a decrement in the active oil rigs between 2015 to 2016, regions such as the Middle East along with Eastern Europe & Eurasia observed a substantial hike in the active rigs.
- Light crude oil dominates the type segment of global crude oil market by capturing the largest market share in 2017.
- Growing demand for fertilizers and petrochemicals in agriculture sector is adding growth to the crude oil demand.
- RESEARCH SCOPE
- STUDY GOALS
- SCOPE OF THE MARKET STUDY
- WHO WILL FIND THIS REPORT USEFUL?
- STUDY AND FORECASTING YEARS
- RESEARCH METHODOLOGY
- SOURCES OF DATA
- SECONDARY DATA
- PRIMARY DATA
- TOP-DOWN APPROACH
- BOTTOM-UP APPROACH
- DATA TRIANGULATION
- SOURCES OF DATA
- EXECUTIVE SUMMARY
- MARKET SUMMARY
- KEY FINDINGS
- ASIA PACIFIC LEADS THE OVERALL CRUDE OIL MARKET
- MIDDLE EAST REGION PRESENTS HUGE GROWTH OPPORTUNITY
- GASOLINE HELD THE LARGEST MARKET SHARE OF THE APPLICATION SEGMENT
- LIGHT CRUDE OIL ACCOUNTED FOR LARGEST SHARE OF THE MARKET BY TYPE SEGMENT
- LPG SEGMENT IS EXPECTED TO GROW AT A FAST PACE
- INCREASED NUMBER OF ACTIVE OIL RIGS ACROSS SEVERAL GEOGRAPHIES
- MARKET DYNAMICS
- PARENT MARKET ANALYSIS: ENERGY MARKET
- ETYMOLOGY OF CRUDE OIL
- MARKET DEFINITION & SCOPE
- DRIVERS
- BOOMING TRANSPORTATION INDUSTRY
- RISE IN EXPORT OF CRUDE OIL TO AID IN MARKET GROWTH
- RISING DEMAND FOR PETROLEUM PRODUCTS
- RESTRAINTS
- VOLATILITY IN CRUDE OIL PRICES
- SEASONAL CHANGES ADVERSELY AFFECT THE DEMAND AND SUPPLY OF CRUDE OIL
- OPPORTUNITIES
- GROWING DEMAND OF FERTILIZERS AND PETROCHEMICALS IN AGRICULTURE SECTOR
- EMERGING ECONOMICS TO OFFER LUCRATIVE GROWTH OPPORTUNITIES
- CHALLENGES
- AVAILABILITY OF ALTERNATIVES SUCH AS NATURAL GAS, BIOFUELS, HYDRO-ENERGY, SOLAR, WIND.
- RISE IN THE TERRITORIAL AND REGIONAL DISPUTES AMONG DIFFERENT NATION
- MARKET BY TYPE
- HEAVY CRUDE OIL
- LIGHT CRUDE OIL
- MARKET BY APPLICATION
- GASOLINE
- DIESEL FUEL & HEATING OIL
- JET FUEL
- LPG
- LIQUID ASPHALT
- OTHER APPLICATION
- KEY ANALYTICS
- PORTER’S FIVE FORCE MODEL
- THREAT OF NEW ENTRANTS
- THREAT OF SUBSTITUTE
- BARGAINING POWER OF SUPPLIERS
- BARGAINING POWER OF BUYERS
- THREAT OF COMPETITIVE RIVALRY
- PRICING ANALYSIS
- KEY BUYING CRITERIA
- COST
- MODE OF TRADE
- GEOGRAPHICAL LOCATION
- OPPORTUNITY MATRIX
- VENDOR LANDSCAPE
- VALUE CHAIN ANALYSIS
- CHEMICAL PROCESSING
- PRODUCERS
- END-USERS
- LEGAL, POLICY & REGULATORY FRAMEWORK
- INVESTMENT ANALYSIS
- BY REGION
- BY APPLICATION
- BY CRUDE OIL TYPE
- PORTER’S FIVE FORCE MODEL
- GEOGRAPHICAL ANALYSIS
- NORTH AMERICA
- UNITED STATES
- CANADA
- EUROPE
- UNITED KINGDOM
- GERMANY
- FRANCE
- RUSSIA
- REST OF EUROPE
- ASIA PACIFIC
- CHINA
- JAPAN
- INDIA
- INDONESIA
- REST OF ASIA PACIFIC
- REST OF WORLD
- LATIN AMERICA
- MIDDLE EAST AND AFRICA
- NORTH AMERICA
- COMPETITIVE LANDSCAPE
- MARKET SHARE ANALYSIS
- KEY COMPANY ANALYSIS
- SAUDI ARAMCO
- NATIONAL IRANIAN OIL COMPANY (NIOC)
- SINOPEC OR CHINA PETROLEUM & CHEMICAL CORPORATION
- GAZPROM
- EXXON MOBIL CORPORATION
- CORPORATE STRATEGIES
- PARTNERSHIP & COLLABORATION
- MERGER & ACQUISITION
- BUSINESS EXPANSION
- INVESTMENT
- COMPANY PROFILES
- BP GLOBAL
- CAIRN INDIA
- CHEVRON CORPORATION
- EXXON MOBIL CORPORATION
- GAZPROM
- KUWAIT PETROLEUM CORPORATION
- LUKOIL
- MARATHON PETROLEUM CORPORATION
- NATIONAL IRANIAN OIL CORPORATION (NIOC)
- OIL AND NATURAL GAS CORPORATION LIMITED (ONGC)
- PEMEX (PETRÓLEOS MEXICANOS)
- ROYAL DUTCH SHELL
- SAUDI ARAMCO
- SINOPEC OR CHINA PETROLEUM & CHEVRON CORPORATION
- TOTAL SA
LIST OF TABLES
TABLE 1: GLOBAL CRUDE OIL MARKET, BY GEOGRAPHY, 2018-2026 (IN $ BILLION)
TABLE 2: PETROLEUM PRODUCTS DEMAND OUTLOOK IN 2016, BY KEY GEOGRAPHIES (1000 B/D)
TABLE 3: GASOLINE DEMAND FLUCTUATION IN UNITED STATES FOR DIFFERENT MONTHS OF THE YEAR 2017 (MILLION BARRELS/DAY)
TABLE 4: WORLD SUPPLY OF AMMONIA, POTASH AND PHOSPHORIC ACID IN 2015-2020
TABLE 5: GLOBAL CRUDE OIL MARKET, BY TYPE, 2018-2026, (IN $ BILLION)
TABLE 6: PRODUCTION CAPACITY ANALYSIS, BY TYPE, 2015-2017 (BILLION BARRELS/DAY)
TABLE 7: CONSUMPTION CAPACITY ANALYSIS, BY TYPE, 2015-2017 (BILLION BARRELS/DAY)
TABLE 8: GLOBAL HEAVY CRUDE OIL MARKET, BY REGION, 2018-2026 (IN $ BILLION)
TABLE 9: GLOBAL LIGHT CRUDE OIL MARKET, BY REGION, 2018-2026 (IN $ BILLION)
TABLE 10: GLOBAL CRUDE OIL MARKET, BY APPLICATION, 2018-2026, (IN $ BILLION)
TABLE 11: PRODUCTION CAPACITY ANALYSIS, BY APPLICATION, 2015-2017 (BILLION BARRELS/DAY)
TABLE 12: CONSUMPTION CAPACITY ANALYSIS, BY APPLICATION, 2015-2017 (BILLION BARRELS/DAY)
TABLE 13: GLOBAL GASOLINE MARKET, BY REGION, 2018-2026 (IN $ BILLION)
TABLE 14: GLOBAL DIESEL FUEL & HEATING OIL MARKET, BY REGION, 2018-2026 (IN $ BILLION)
TABLE 15: GLOBAL JET FUEL MARKET, BY REGION, 2018-2026 (IN $ BILLION)
TABLE 16: GLOBAL LPG MARKET, BY REGION, 2018-2026 (IN $ BILLION)
TABLE 17: GLOBAL LIQUID ASPHALT MARKET, BY REGION, 2018-2026 (IN $ BILLION)
TABLE 18: GLOBAL OTHER APPLICATION MARKET, BY REGION, 2018-2026 (IN $ BILLION)
TABLE 19: OPPORTUNITY MATRIX
TABLE 20: VENDOR LANDSCAPE
TABLE 21: LEGAL, POLICY & REGULATORY FRAMEWORK
TABLE 22: GLOBAL CRUDE OIL MARKET, BY GEOGRAPHY, 2018-2026, (IN $ BILLION)
TABLE 23: PRODUCTION CAPACITY ANALYSIS, BY GEOGRAPHY, 2015-2017 (BILLION BARRELS/DAY)
TABLE 24: CONSUMPTION CAPACITY ANALYSIS, BY GEOGRAPHY, 2015-2017 (BILLION BARRELS/DAY)
TABLE 25: NORTH AMERICA CRUDE OIL MARKET, BY COUNTRY, 2018-2026 (IN $ BILLION)
TABLE 26: PRODUCTION CAPACITY ANALYSIS IN NORTH AMERICA, 2015-2017 (BILLION BARRELS/DAY)
TABLE 27: CONSUMPTION CAPACITY ANALYSIS IN NORTH AMERICA, 2015-2017 (BILLION BARRELS/DAY)
TABLE 28: EUROPE CRUDE OIL MARKET, BY COUNTRY, 2018-2026 (IN $ BILLION)
TABLE 29: PRODUCTION CAPACITY ANALYSIS IN EUROPE, 2015-2017 (BILLION BARRELS/DAY)
TABLE 30: CONSUMPTION CAPACITY ANALYSIS IN EUROPE, 2015-2017 (BILLION BARRELS/DAY)
TABLE 31: ASIA PACIFIC CRUDE OIL MARKET, BY COUNTRY, 2018-2026 (IN $ BILLION)
TABLE 32: PRODUCTION CAPACITY ANALYSIS IN ASIA PACIFIC, 2015-2017 (BILLION BARRELS/DAY)
TABLE 33: CONSUMPTION CAPACITY ANALYSIS IN ASIA PACIFIC, 2015-2017 (BILLION BARRELS/DAY)
TABLE 34: REST OF WORLD CRUDE OIL MARKET, BY REGION, 2018-2026 (IN $ BILLION)
TABLE 35: PRODUCTION CAPACITY ANALYSIS IN REST OF WORLD, 2015-2017 (BILLION BARRELS/DAY)
TABLE 36: CONSUMPTION CAPACITY ANALYSIS IN REST OF WORLD, 2015-2017 (BILLION BARRELS/DAY)
TABLE 37: LIST OF PRODUCT PARTNERSHIP & COLLABORATION
TABLE 38: LIST OF PRODUCT MERGER & ACQUISITION
TABLE 39: LIST OF BUSINESS EXPANSION
TABLE 40: LIST OF INVESTMENT
LIST OF FIGURES
FIGURE 1: GLOBAL CRUDE OIL MARKET, BY TYPE, 2017 & 2026 (IN %)
FIGURE 2: ASIA PACIFIC CRUDE OIL MARKET, 2018 – 2026 (IN $ BILLION)
FIGURE 3: REGION WISE ACTIVE OIL RIGS, 2015 & 2016 (IN %)
FIGURE 4: TIMELINE OF CRUDE OIL
FIGURE 5: RISE IN THE COMMERCIAL VEHICLE SALES, 2005-2017 (IN MILLION UNITS)
FIGURE 6: TOTAL PASSENGER CARS SALES, 2005-2017 (IN MILLION UNITS)
FIGURE 7: PASSENGER CARS WITH FUEL TYPES (Q1-2018)
FIGURE 8: TOTAL SALES OF MOTOR VEHICLE, 2005-2017 (IN MILLION UNITS)
FIGURE 9: EXPORTS OF CRUDE OIL IN KEY GEOGRAPHIES, 2010-2016 (1000 B/D)
FIGURE 10: WORLDWIDE EXPORTS OF CRUDE OIL IN, 2010-2016 (1000 B/D)
FIGURE 11: CONSUMPTION OF DIFFERENT SOURCES OF ENERGY/FUELS BY TRANSPORTATION IN UNITED STATES, 2016 (IN %)
FIGURE 12: FLUCTUATIONS IN CRUDE OIL PRICES, 2000-2016, ($ PER BARREL)
FIGURE 13: KEY PLASTIC PRODUCING COUNTRIES IN THE WORLD
FIGURE 14: DIESEL SALES IN INDIA, 2009-2015, (MB/D)
FIGURE 15: DEMAND FOR GASOLINE PRODUCT IN INDIA, 2009-2015, (MB/D)
FIGURE 16: RISE IN THE IMPORTS OF CRUDE OIL IN THE EMERGING MARKET
FIGURE 17: VEHICLE PRODUCTION IN CHINA, 2014-2016, (IN UNITS)
FIGURE 18: OIL DEMAND IN THE EMERGING MARKET (1000/BD)
FIGURE 19: GLOBAL CRUDE OIL MARKET, BY HEAVY CRUDE OIL, 2018-2026 (IN $ BILLION)
FIGURE 20: GLOBAL CRUDE OIL MARKET, BY LIGHT CRUDE OIL, 2018-2026 (IN $ BILLION)
FIGURE 21: GLOBAL CRUDE OIL MARKET, BY GASOLINE, 2018-2026 (IN $ BILLION)
FIGURE 22: GLOBAL CRUDE OIL MARKET, BY DIESEL FUEL & HEATING OIL, 2018-2026 (IN $ BILLION)
FIGURE 23: GLOBAL CRUDE OIL MARKET, BY JET FUEL, 2018-2026 (IN $ BILLION)
FIGURE 24: GLOBAL CRUDE OIL MARKET, BY LPG, 2018-2026 (IN $ BILLION)
FIGURE 25: GLOBAL CRUDE OIL MARKET, BY LIQUID ASPHALT, 2018-2026 (IN $ BILLION)
FIGURE 26: GLOBAL CRUDE OIL MARKET, BY OTHER APPLICATION, 2018-2026 (IN $ BILLION)
FIGURE 27: PORTER’S FIVE FORCE MODEL OF CRUDE OIL MARKET
FIGURE 28: PRICING ANALYSIS
FIGURE 29: FLUCTUATIONS IN CRUDE OIL PRICES, 2015-2019 ($ PER BARREL)
FIGURE 30: KEY BUYING IMPACT ANALYSIS
FIGURE 31: VALUE CHAIN ANALYSIS
FIGURE 32: INVESTMENT ANALYSIS OF CRUDE OIL MARKET, BY REGION, IN 2017
FIGURE 33: INVESTMENT ANALYSIS OF CRUDE OIL MARKET, BY APPLICATION, IN 2017
FIGURE 34: INVESTMENT ANALYSIS OF CRUDE OIL MARKET, BY CRUDE OIL TYPE, IN 2017
FIGURE 35: GLOBAL CRUDE OIL MARKET, REGIONAL OUTLOOK, 2017 & 2026 (IN %)
FIGURE 36: UNITED STATES CRUDE OIL MARKET, 2018-2026 (IN $ BILLION)
FIGURE 37: CANADA CRUDE OIL MARKET, 2018-2026 (IN $ BILLION)
FIGURE 38: UNITED KINGDOM CRUDE OIL MARKET, 2018-2026 (IN $ BILLION)
FIGURE 39: GERMANY CRUDE OIL MARKET, 2018-2026 (IN $ BILLION)
FIGURE 40: FRANCE CRUDE OIL MARKET, 2018-2026 (IN $ BILLION)
FIGURE 41: RUSSIA CRUDE OIL MARKET, 2018-2026 (IN $ BILLION)
FIGURE 42: REST OF EUROPE CRUDE OIL MARKET, 2018-2026 (IN $ BILLION)
FIGURE 43: CHINA CRUDE OIL MARKET, 2018-2026 (IN $ BILLION)
FIGURE 44: JAPAN CRUDE OIL MARKET, 2018-2026 (IN $ BILLION)
FIGURE 45: INDIA CRUDE OIL MARKET, 2018-2026 (IN $ BILLION)
FIGURE 46: INDONESIA CRUDE OIL MARKET, 2018-2026 (IN $ BILLION)
FIGURE 47: REST OF ASIA PACIFIC CRUDE OIL MARKET, 2018-2026 (IN $ BILLION)
FIGURE 48: LATIN AMERICA CRUDE OIL MARKET, 2018-2026 (IN $ BILLION)
FIGURE 49: MIDDLE EAST AND AFRICA CRUDE OIL MARKET, BY COUNTRY, 2018-2026 (IN $ BILLION)
FIGURE 50: MARKET SHARE ANALYSIS OF KEY PLAYERS IN 2017
- MARKET BY TYPE
- HEAVY CRUDE OIL
- LIGHT CRUDE OIL
- MARKET BY APPLICATION
- GASOLINE
- DIESEL FUEL & HEATING OIL
- JET FUEL
- LPG
- LIQUID ASPHALT
- OTHER APPLICATION
- GEOGRAPHICAL ANALYSIS
- NORTH AMERICA
- UNITED STATES
- CANADA
- EUROPE
- UNITED KINGDOM
- GERMANY
- FRANCE
- RUSSIA
- REST OF EUROPE
- ASIA PACIFIC
- CHINA
- JAPAN
- INDIA
- INDONESIA
- REST OF ASIA PACIFIC
- REST OF WORLD
- LATIN AMERICA
- MIDDLE EAST AND AFRICA
- NORTH AMERICA
To request a free sample copy of this report, please complete the form below :
We offer 10% free customization including country-level data, niche applications and competitive landscape with every report.