
GLOBAL FLYWHEEL ENERGY STORAGE MARKET FORECAST 2020-2028
Global Flywheel Energy Storage Market by Application (Uninterruptible Power Supply, Distributed Energy Generation, Transport, Data Centres, Others) by Geography.
Inkwood Research estimates the global market for flywheel energy storage to grow at a CAGR of 7.50% in terms of revenue and 8.32% in terms of volume during the forecast period, reaching a revenue of $570.74 million, and in terms of volume, 310.06 Kilo Watt, by 2028. The base year for the market study is 2019, while the forecasted period is between 2020 and 2028.
The global flywheel energy storage market is propelled by:
- Increasing adoption of renewable energy
- Growing demand for uninterrupted power supply (UPS)
- Increased use of flywheels in the utility sector
To know more about this report, request a free sample copy.
Energy storage is important in renewable power generation since renewable sources such as wind and solar are intermittent in nature. The energy produced from wind varies as per its velocity. In such cases, it becomes imperative to store the excess energy, but not to overload the grid or cause wastage. Flywheel technology instantaneously responds to control signals and can be 100 times quicker than traditional generation sources. For instance, Beacon Power has designed flywheels to provide 20 MW of energy, and its response time is less than four seconds. One of the key challenges is managing grid reliability. Flywheel energy storage is increasingly used in the utility sector to balance the grid, i.e., regulate voltage up or down, spinning reserve, voltage support. Several developing countries are investing in energy storage technologies to optimize the electrical grid and increase reliability, resilience, and efficiency. Hence, advanced energy storage plays a major role in the utility sector.
Distributed energy generation is the fastest and leading segment in terms of revenue in the global flywheel energy storage market, with around 21.60% market share in 2019. Distributed energy generation using flywheels is expected to reduce the dependency on fossil fuels and has augmented the use of renewable sources for power generation. For instance, in the US, Beacon Power in 2014 pioneered flywheel technology for frequency regulation with a 20 MW power plant. Also, nearly 10% of the overall frequency regulation needs in New York are provided by the Stephentown plant, which is a flywheel-based power plant.
On the other hand, the global flywheel energy storage market growth is restricted by the growing popularity of battery storage, high initial cost, and low tensile strength. Apart from flywheels, some of the other commonly used energy storage systems include sodium-sulfur (Na-S) batteries, lithium-ion batteries, and lead-acid batteries. Lithium-ion batteries are lightweight, since lithium is the third lightest element in the world. Also, the use of non-aqueous electrolytes helps these batteries achieve high operating voltages as compared to other batteries. Besides, as these batteries are compact in size, they can be carried anywhere. These batteries are characterized by high maintenance costs and short life cycles. However, with innovations, these batteries have achieved increased efficiency and longer operational life of 3 to 4 years. The biggest challenge faced by the market is overcoming the competition it faces from these battery storage systems.
The report on the global flywheel energy storage market includes segmentation analysis on the basis of application.
Market by Application:
- UPS
- Distributed Energy Generation
- Transport
- Data Centers
- Others
Geographically, the global flywheel energy storage market has been segmented on the basis of four major regions, which includes:
- North America: the United States & Canada
- Europe: United Kingdom, France, Germany, Italy, Belgium, Poland, Russia & Rest of Europe
- Asia Pacific: China, Japan, India, South Korea, Indonesia, Thailand, Vietnam, Australia& New Zealand & the rest of Asia Pacific
- Rest of World: Latin America, Middle East & Africa
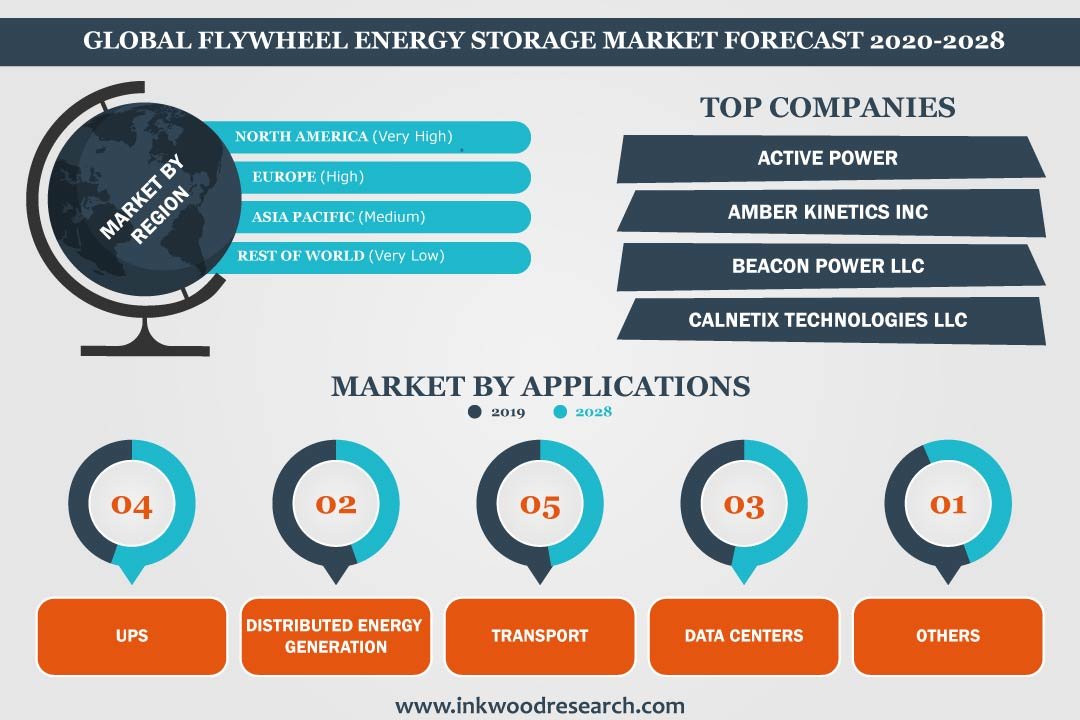
In 2019, North America captured the largest market share of about 66.12% in terms of revenue. The dominance of North America is attributed to the presence of a majority of the key players that are offering their solutions in the region. These include Active Power, Calnetix Technologies, Llc, Temporal Power Ltd. & others. The number of installations has significantly increased owing to high investment by public and corporate financial investors. Also, the increase in energy needs across the region leads to a higher demand for efficient and reliable energy storage systems. On the other hand, Europe is anticipated to be the fastest-growing region with a CAGR of 7.80% during the forecast period. The investment to increase the production of renewable energy is an ongoing trend, which is predicted to boost the market. This investment is for adopting high-end technology systems for the storage of the produced renewable energy, which would further strengthen the position of Europe in the global flywheel energy storage market.
The key market players involved in the global flywheel energy storage market include:
- Active Power
- Amber Kinetics,Inc.
- Piller Group GmbH
- ABB Limited
- Powerthru
- Others
In September 2019, Active Power launched, CLEANSOURCE® PLUS, a battery-free UPS that offers 20% more power and cost-saving per kilowatt. In June 2018, Abb Limited launched Cyberex®SuperSwitch®4,200-2000A digital static transfer switch that helps in uptime and business continuity of customers.
Key findings of the global flywheel energy storage market:
- North America leads the flywheel energy storage market by capturing the largest market share, in terms of revenue, of around 66.12% in 2019.
- The Europe flywheel energy storage market is anticipated to grow at the highest CAGR of 7.80%, in terms of revenue, during the forecast period of 2020-2028.
- The distributed energy generation segment is anticipated to grow at the highest CAGR of 9.99% amongst the applications during the forecast period of 2020-2028.
- The growing demand for uninterrupted power supply (UPS) and the growing automotive industry is fueling growth in the global flywheel energy storage market.
- RESEARCH SCOPE & METHODOLOGY
- STUDY OBJECTIVES
- SCOPE OF STUDY
- METHODOLOGY
- ASSUMPTIONS & LIMITATIONS
- EXECUTIVE SUMMARY
- MARKET SIZE & ESTIMATES
- MARKET OVERVIEW
- MARKET DYNAMICS
- MARKET DEFINITION
- KEY DRIVERS
- INCREASING ADOPTION OF RENEWABLE ENERGY
- GROWING DEMAND FOR UNINTERRUPTED POWER SUPPLY (UPS)
- INCREASED USE OF FLYWHEELS IN UTILITY SECTOR
- KEY RESTRAINTS
- GROWING POPULARITY OF BATTERY STORAGE
- HIGH INITIAL COST
- LOW TENSILE STRENGTH
- KEY ANALYTICS
- KEY INVESTMENT INSIGHTS
- PORTER’S FIVE FORCE ANALYSIS
- BUYER POWER
- SUPPLIER POWER
- SUBSTITUTION
- NEW ENTRANTS
- INDUSTRY RIVALRY
- OPPORTUNITY MATRIX
- VENDOR LANDSCAPE
- MARKET BY APPLICATION
- UNINTERRUPTIBLE POWER SUPPLY
- DISTRIBUTED ENERGY GENERATION
- TRANSPORT
- DATA CENTRES
- OTHERS
- GEOGRAPHICAL ANALYSIS
- NORTH AMERICA
- UNITED STATES
- CANADA
- EUROPE
- UNITED KINGDOM
- GERMANY
- FRANCE
- ITALY
- RUSSIA
- BELGIUM
- POLAND
- REST OF EUROPE
- ASIA PACIFIC
- CHINA
- JAPAN
- INDIA
- SOUTH KOREA
- INDONESIA
- THAILAND
- VIETNAM
- AUSTRALIA & NEW ZEALAND
- REST OF ASIA PACIFIC
- REST OF WORLD
- LATIN AMERICA
- MIDDLE EAST & AFRICA
- NORTH AMERICA
- COMPANY PROFILES
- ACTIVE POWER
- AMBER KINETICS, INC.
- BEACON POWER, LLC
- CALNETIX TECHNOLOGIES, LLC
- ACUMENTRICS INC.
- PILLER GROUP GMBH
- POWERTHRU
- TEMPORAL POWER LTD
- ABB LIMITED
- ADAPTIVE BALANCING POWER
- SCHWUNGRAD ENERGIE LTD.
- STORNETIC
- AMERICAN MAGLEV TECHNOLOGY
TABLE LIST
TABLE 1: MARKET SNAPSHOT – FLYWHEEL ENERGY STORAGE
TABLE 2: GLOBAL FLYWHEEL ENERGY STORAGE MARKET, BY APPLICATION, HISTORICAL YEARS, 2016-2019 (IN $ MILLION)
TABLE 3: GLOBAL FLYWHEEL ENERGY STORAGE MARKET, BY APPLICATION, FORECAST YEARS, 2020-2028 (IN $ MILLION)
TABLE 4: GLOBAL FLYWHEEL ENERGY STORAGE MARKET, BY APPLICATION, HISTORICAL YEARS, 2016-2019 (IN KW)
TABLE 5: GLOBAL FLYWHEEL ENERGY STORAGE MARKET, BY APPLICATION, FORECAST YEARS, 2020-2028 (IN KW)
TABLE 6: GLOBAL UNINTERRUPTIBLE POWER SUPPLY MARKET, BY REGION, HISTORICAL YEARS, 2016-2019 (IN $ MILLION)
TABLE 7: GLOBAL UNINTERRUPTIBLE POWER SUPPLY MARKET, BY REGION, FORECAST YEARS, 2020-2028 (IN $ MILLION)
TABLE 8: GLOBAL UNINTERRUPTIBLE POWER SUPPLY MARKET, BY REGION, HISTORICAL YEARS, 2016-2019 (IN KW)
TABLE 9: GLOBAL UNINTERRUPTIBLE POWER SUPPLY MARKET, BY REGION, FORECAST YEARS, 2020-2028 (IN KW)
TABLE 10: GLOBAL DISTRIBUTED ENERGY GENERATION MARKET, BY REGION, HISTORICAL YEARS, 2016-2019 (IN $ MILLION)
TABLE 11: GLOBAL DISTRIBUTED ENERGY GENERATION MARKET, BY REGION, FORECAST YEARS, 2020-2028 (IN $ MILLION)
TABLE 12: GLOBAL DISTRIBUTED ENERGY GENERATION MARKET, BY REGION, HISTORICAL YEARS, 2016-2019 (IN KW)
TABLE 13: GLOBAL DISTRIBUTED ENERGY GENERATION MARKET, BY REGION, FORECAST YEARS, 2020-2028 (IN KW)
TABLE 14: GLOBAL TRANSPORT MARKET, BY REGION, HISTORICAL YEARS, 2016-2019 (IN $ MILLION)
TABLE 15: GLOBAL TRANSPORT MARKET, BY REGION, FORECAST YEARS, 2020-2028 (IN $ MILLION)
TABLE 16: GLOBAL TRANSPORT MARKET, BY REGION, HISTORICAL YEARS, 2016-2019 (IN KW)
TABLE 17: GLOBAL TRANSPORT MARKET, BY REGION, FORECAST YEARS, 2020-2028 (IN KW)
TABLE 18: GLOBAL DATA CENTRES MARKET, BY REGION, HISTORICAL YEARS, 2016-2019 (IN $ MILLION)
TABLE 19: GLOBAL DATA CENTRES MARKET, BY REGION, FORECAST YEARS, 2020-2028 (IN $ MILLION)
TABLE 20: GLOBAL DATA CENTRES MARKET, BY REGION, HISTORICAL YEARS, 2016-2019 (IN KW)
TABLE 21: GLOBAL DATA CENTRES MARKET, BY REGION, FORECAST YEARS, 2020-2028 (IN KW)
TABLE 22: GLOBAL OTHERS MARKET, BY REGION, HISTORICAL YEARS, 2016-2019 (IN $ MILLION)
TABLE 23: GLOBAL OTHERS MARKET, BY REGION, FORECAST YEARS, 2020-2028 (IN $ MILLION)
TABLE 24: GLOBAL OTHERS MARKET, BY REGION, HISTORICAL YEARS, 2016-2019 (IN KW)
TABLE 25: GLOBAL OTHERS MARKET, BY REGION, FORECAST YEARS, 2020-2028 (IN KW)
TABLE 26: GLOBAL FLYWHEEL ENERGY STORAGE MARKET, BY GEOGRAPHY, HISTORICAL YEARS, 2016-2019 (IN $ MILLION)
TABLE 27: GLOBAL FLYWHEEL ENERGY STORAGE MARKET, BY GEOGRAPHY, FORECAST YEARS, 2020-2028 (IN $ MILLION)
TABLE 28: GLOBAL FLYWHEEL ENERGY STORAGE MARKET, BY GEOGRAPHY, HISTORICAL YEARS, 2016-2019 (IN KW)
TABLE 29: GLOBAL FLYWHEEL ENERGY STORAGE MARKET, BY GEOGRAPHY, FORECAST YEARS, 2020-2028 (IN KW)
TABLE 30: NORTH AMERICA FLYWHEEL ENERGY STORAGE MARKET, BY COUNTRY, HISTORICAL YEARS, 2016-2019 (IN $ MILLION)
TABLE 31: NORTH AMERICA FLYWHEEL ENERGY STORAGE MARKET, BY COUNTRY, FORECAST YEARS, 2020-2028 (IN $ MILLION)
TABLE 32: NORTH AMERICA FLYWHEEL ENERGY STORAGE MARKET, BY COUNTRY, HISTORICAL YEARS, 2016-2019 (IN KW)
TABLE 33: NORTH AMERICA FLYWHEEL ENERGY STORAGE MARKET, BY COUNTRY, FORECAST YEARS, 2020-2028 (IN KW)
TABLE 34: EUROPE FLYWHEEL ENERGY STORAGE MARKET, BY COUNTRY, HISTORICAL YEARS, 2016-2019 (IN $ MILLION)
TABLE 35: EUROPE FLYWHEEL ENERGY STORAGE MARKET, BY COUNTRY, FORECAST YEARS, 2020-2028 (IN $ MILLION)
TABLE 36: EUROPE FLYWHEEL ENERGY STORAGE MARKET, BY COUNTRY, HISTORICAL YEARS, 2016-2019 (IN KW)
TABLE 37: EUROPE FLYWHEEL ENERGY STORAGE MARKET, BY COUNTRY, FORECAST YEARS, 2020-2028 (IN KW)
TABLE 38: ASIA PACIFIC FLYWHEEL ENERGY STORAGE MARKET, BY COUNTRY, HISTORICAL YEARS, 2016-2019 (IN $ MILLION)
TABLE 39: ASIA PACIFIC FLYWHEEL ENERGY STORAGE MARKET, BY COUNTRY, FORECAST YEARS, 2020-2028 (IN $ MILLION)
TABLE 40: ASIA PACIFIC FLYWHEEL ENERGY STORAGE MARKET, BY COUNTRY, HISTORICAL YEARS, 2016-2019 (IN KW)
TABLE 41: ASIA PACIFIC FLYWHEEL ENERGY STORAGE MARKET, BY COUNTRY, FORECAST YEARS, 2020-2028 (IN KW)
TABLE 42: REST OF WORLD FLYWHEEL ENERGY STORAGE MARKET, BY REGION, HISTORICAL YEARS, 2016-2019 (IN $ MILLION)
TABLE 43: REST OF WORLD FLYWHEEL ENERGY STORAGE MARKET, BY REGION, FORECAST YEARS, 2020-2028 (IN $ MILLION)
TABLE 44: REST OF WORLD FLYWHEEL ENERGY STORAGE MARKET, BY REGION, HISTORICAL YEARS, 2016-2019 (IN KW)
TABLE 45: REST OF WORLD FLYWHEEL ENERGY STORAGE MARKET, BY REGION, FORECAST YEARS, 2020-2028 (IN KW)
FIGURE LIST
FIGURE 1: GLOBAL FLYWHEEL ENERGY STORAGE MARKET, BY REGION, 2019 & 2028 (IN %)
FIGURE 2: KEY INVESTMENT INSIGHTS
FIGURE 3: PORTER’S FIVE FORCE ANALYSIS
FIGURE 4: OPPORTUNITY MATRIX
FIGURE 5: VENDOR LANDSCAPE
FIGURE 6: GLOBAL FLYWHEEL ENERGY STORAGE MARKET, GROWTH POTENTIAL BY APPLICATION, IN 2019
FIGURE 7: GLOBAL FLYWHEEL ENERGY STORAGE MARKET, UNINTERRUPTIBLE POWER SUPPLY, 2020-2028 (IN $ MILLION)
FIGURE 8: TYPES OF UPS THAT IMPLEMENT FLYWHEELS
FIGURE 9: GLOBAL FLYWHEEL ENERGY STORAGE MARKET, DISTRIBUTED ENERGY GENERATION, 2020-2028 (IN $ MILLION)
FIGURE 10: FLYWHEEL APPLICATION IN DISTRIBUTED ENERGY GENERATION
FIGURE 11: GLOBAL FLYWHEEL ENERGY STORAGE MARKET, TRANSPORT, 2020-2028 (IN $ MILLION)
FIGURE 12: GLOBAL FLYWHEEL ENERGY STORAGE MARKET, DATA CENTRES, 2020-2028 (IN $ MILLION)
FIGURE 13: GLOBAL FLYWHEEL ENERGY STORAGE MARKET, OTHERS, 2020-2028 (IN $ MILLION)
FIGURE 14: NORTH AMERICA FLYWHEEL ENERGY STORAGE MARKET, REGIONAL OUTLOOK, 2019 & 2028 (IN %)
FIGURE 15: UNITED STATES FLYWHEEL ENERGY STORAGE MARKET, 2020-2028 (IN $ MILLION)
FIGURE 16: CANADA FLYWHEEL ENERGY STORAGE MARKET, 2020-2028 (IN $ MILLION)
FIGURE 17: EUROPE FLYWHEEL ENERGY STORAGE MARKET, REGIONAL OUTLOOK, 2019 & 2028 (IN %)
FIGURE 18: UNITED KINGDOM FLYWHEEL ENERGY STORAGE MARKET, 2020-2028 (IN $ MILLION)
FIGURE 19: GERMANY FLYWHEEL ENERGY STORAGE MARKET, 2020-2028 (IN $ MILLION)
FIGURE 20: FRANCE FLYWHEEL ENERGY STORAGE MARKET, 2020-2028 (IN $ MILLION)
FIGURE 21: ITALY FLYWHEEL ENERGY STORAGE MARKET, 2020-2028 (IN $ MILLION)
FIGURE 22: RUSSIA FLYWHEEL ENERGY STORAGE MARKET, 2020-2028 (IN $ MILLION)
FIGURE 23: BELGIUM FLYWHEEL ENERGY STORAGE MARKET, 2020-2028 (IN $ MILLION)
FIGURE 24: POLAND FLYWHEEL ENERGY STORAGE MARKET, 2020-2028 (IN $ MILLION)
FIGURE 25: REST OF EUROPE FLYWHEEL ENERGY STORAGE MARKET, 2020-2028 (IN $ MILLION)
FIGURE 26: ASIA PACIFIC FLYWHEEL ENERGY STORAGE MARKET, REGIONAL OUTLOOK, 2019 & 2028 (IN %)
FIGURE 27: CHINA FLYWHEEL ENERGY STORAGE MARKET, 2020-2028 (IN $ MILLION)
FIGURE 28: JAPAN FLYWHEEL ENERGY STORAGE MARKET, 2020-2028 (IN $ MILLION)
FIGURE 29: INDIA FLYWHEEL ENERGY STORAGE MARKET, 2020-2028 (IN $ MILLION)
FIGURE 30: SOUTH KOREA FLYWHEEL ENERGY STORAGE MARKET, 2020-2028 (IN $ MILLION)
FIGURE 31: INDONESIA FLYWHEEL ENERGY STORAGE MARKET, 2020-2028 (IN $ MILLION)
FIGURE 32: THAILAND FLYWHEEL ENERGY STORAGE MARKET, 2020-2028 (IN $ MILLION)
FIGURE 33: VIETNAM FLYWHEEL ENERGY STORAGE MARKET, 2020-2028 (IN $ MILLION)
FIGURE 34: AUSTRALIA & NEW ZEALAND FLYWHEEL ENERGY STORAGE MARKET, 2020-2028 (IN $ MILLION)
FIGURE 35: REST OF ASIA PACIFIC FLYWHEEL ENERGY STORAGE MARKET, 2020-2028 (IN $ MILLION)
FIGURE 36: REST OF WORLD FLYWHEEL ENERGY STORAGE MARKET, REGIONAL OUTLOOK, 2019 & 2028 (IN %)
FIGURE 37: LATIN AMERICA FLYWHEEL ENERGY STORAGE MARKET, 2020-2028 (IN $ MILLION)
FIGURE 38: MIDDLE EAST & AFRICA FLYWHEEL ENERGY STORAGE MARKET, 2020-2028 (IN $ MILLION)
- MARKET BY APPLICATION
- UNINTERRUPTIBLE POWER SUPPLY
- DISTRIBUTED ENERGY GENERATION
- TRANSPORT
- DATA CENTRES
- OTHERS
- GEOGRAPHICAL ANALYSIS
- NORTH AMERICA
- UNITED STATES
- CANADA
- EUROPE
- UNITED KINGDOM
- GERMANY
- FRANCE
- ITALY
- RUSSIA
- BELGIUM
- POLAND
- REST OF EUROPE
- ASIA PACIFIC
- CHINA
- JAPAN
- INDIA
- SOUTH KOREA
- INDONESIA
- THAILAND
- VIETNAM
- AUSTRALIA & NEW ZEALAND
- REST OF ASIA PACIFIC
- REST OF WORLD
- LATIN AMERICA
- MIDDLE EAST & AFRICA
- NORTH AMERICA
To request a free sample copy of this report, please complete the form below :
We offer 10% free customization including country-level data, niche applications and competitive landscape with every report.