
EUROPE ANTI-RHEUMATICS MARKET FORECAST 2020-2028
Europe Anti-rheumatics Market by Type (Prescription-based Drugs, Over-the-counter Drugs) by Drug Class (Disease Modifying Anti-rheumatic Drugs, Nonsteroidal Anti-inflammatory Drugs, Corticosteroids, Uric Acid Drugs, Other Drug Class) and by Geography.
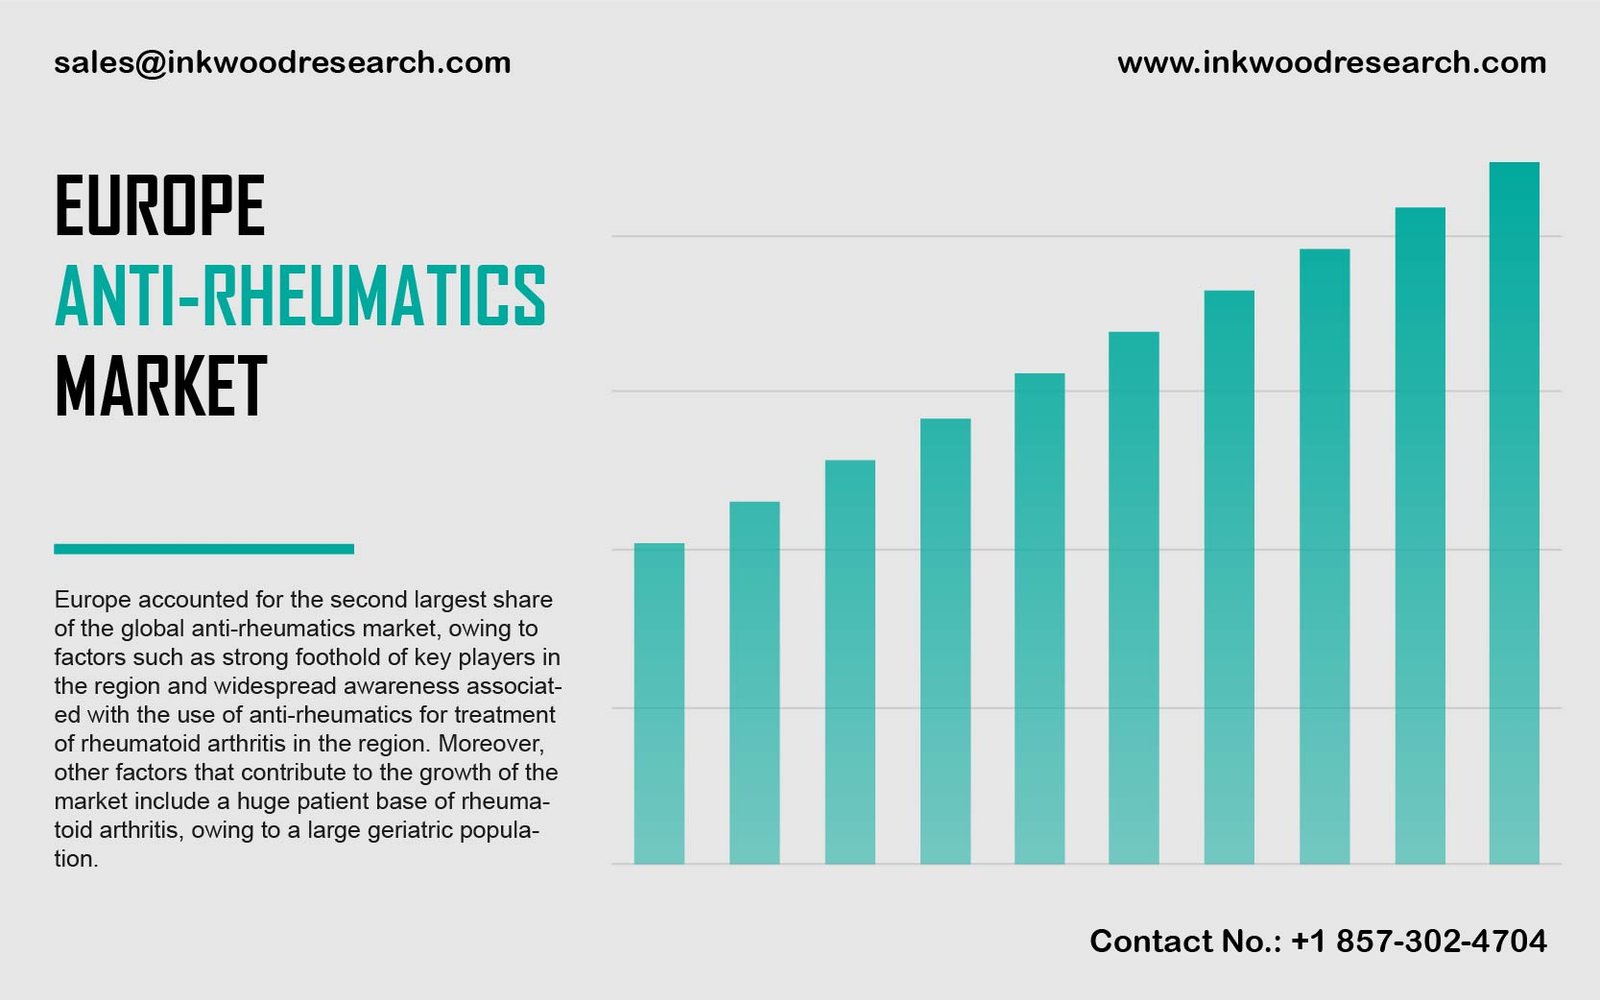
The Europe anti-rheumatics market is anticipated to reach a CAGR of 2.10% over the estimated period of 2020-2028. The significant factors contributing to the growth of the market are the widespread awareness associated with the anti-rheumatics for the treatment of rheumatoid arthritis, and the strong foothold of major players.
The Europe anti-rheumatics market is further surveyed by segregating the region into countries such as Germany, Italy, France, Russia, Poland, the UK, Belgium, and the rest of Europe. In the UK, there is a surge in the prevalence of rheumatoid arthritis, and a rise in awareness related to the early diagnosis of rheumatoid arthritis for better management and treatment of the condition, thereby boosting the market growth in the country. In France, the diagnosis and treatment rates are lower than the US, but are approximately equal to other European countries. France has a universal healthcare system that provides extensive coverage for the cost of drugs.
In Germany, the available tests used for the diagnosis of RA are x-ray and blood tests. The drug treatment rates for patients with mild disease are lower than the other European countries. The financial burden of RA and the costs associated with the use of biologics is majorly on the healthcare system and not on the patient as in most European countries. In countries like Italy, the RA patients are diagnosed and treated by rheumatologists following the 2013 EULAR guidelines and 2012 recommendations from the Italian Society for Rheumatology. All of these factors are boosting the market growth.
UCB, headquartered in Brussels, Belgium, is a biopharmaceutical company specializing in the treatment of central nervous system disorders and inflammatory diseases.
To request a free sample copy of this report, please complete the form below :
We offer 10% free customization including country-level data, niche applications and competitive landscape with every report.
- RESEARCH SCOPE & METHODOLOGY
- STUDY OBJECTIVES
- SCOPE OF STUDY
- METHODOLOGY
- ASSUMPTIONS & LIMITATIONS
- EXECUTIVE SUMMARY
- MARKET SIZE & ESTIMATES
- MARKET OVERVIEW
- MARKET DYNAMICS
- MARKET DEFINITION
- KEY DRIVERS
- RISING GERIATRIC POPULATION
- SURGE IN THE PREVALENCE OF RHEUMATOID ARTHRITIS DISEASE
- GROWING HEALTHCARE EXPENDITURE
- KEY RESTRAINTS
- PATENT EXPIRATIONS
- LACK OF REGULATORY GUIDELINES FOR BIOSIMILARS WILL DELAY THEIR AVAILABILITY IN SOME REGIONS
- LESS EXPENSIVE ALTERNATIVES
- KEY ANALYTICS
- PORTER’S FIVE FORCE ANALYSIS
- THREAT OF NEW ENTRY
- THREAT OF SUBSTITUTION
- BUYER’S POWER
- SUPPLIER’S POWER
- COMPETITIVE RIVALRY
- ETIOLOGY OF RHEUMATOID ARTHRITIS (RA)
- SYMPTOMS OF RHEUMATOID ARTHRITIS
- RISK FACTORS ASSOCIATED WITH RHEUMATOID ARTHRITIS
- OPPORTUNITY MATRIX
- VENDOR LANDSCAPE
- KEY INVESTMENT INSIGHTS
- PORTER’S FIVE FORCE ANALYSIS
- MARKET BY TYPE
- PRESCRIPTION-BASED DRUGS
- OVER-THE-COUNTER DRUGS
- MARKET BY DRUG CLASS
- DISEASE MODIFYING ANTI-RHEUMATIC DRUGS
- NONSTEROIDAL ANTI-INFLAMMATORY DRUGS
- CORTICOSTEROIDS
- URIC ACID DRUGS
- OTHER DRUG CLASS
- GEOGRAPHICAL ANALYSIS
- EUROPE
- THE UNITED KINGDOM
- FRANCE
- GERMANY
- ITALY
- RUSSIA
- BELGIUM
- POLAND
- REST OF EUROPE
- EUROPE
- COMPANY PROFILES
- ABBOTT LABORATORIES
- ABBVIE INC
- AMGEN INC
- BECTON, DICKINSON & COMPANY (BD)
- BIO-RAD LABORATORIES INC
- BRISTOL-MYERS SQUIBB COMPANY
- ELI LILLY & COMPANY
- LUPIN LIMITED
- HOFFMANN-LA ROCHE
- JOHNSON & JOHNSON
- MERCK & CO INC
- NOVARTIS AG
- PERKINELMER
- PFIZER INC
- UCB
TABLE LIST
TABLE 1: MARKET SNAPSHOT – ANTI-RHEUMATICS
TABLE 2: COMMON SYMPTOMS OF RHEUMATOID ARTHRITIS
TABLE 3: RISK FACTORS FOR RHEUMATOID ARTHRITIS
TABLE 4: EUROPE ANTI-RHEUMATICS MARKET, BY TYPE, HISTORICAL YEARS, 2016-2019 (IN $ MILLION)
TABLE 5: EUROPE ANTI-RHEUMATICS MARKET, BY TYPE, FORECAST YEARS, 2020-2028 (IN $ MILLION)
TABLE 6: EUROPE PRESCRIPTION-BASED DRUGS MARKET, HISTORICAL YEARS, 2016-2019 (IN $ MILLION)
TABLE 7: EUROPE PRESCRIPTION-BASED DRUGS MARKET, FORECAST YEARS, 2020-2028 (IN $ MILLION)
TABLE 8: EUROPE OVER-THE-COUNTER DRUGS MARKET, HISTORICAL YEARS, 2016-2019 (IN $ MILLION)
TABLE 9: EUROPE OVER-THE-COUNTER DRUGS MARKET, FORECAST YEARS, 2020-2028 (IN $ MILLION)
TABLE 10: EUROPE ANTI-RHEUMATICS MARKET, BY DRUG CLASS, HISTORICAL YEARS, 2016-2019 (IN $ MILLION)
TABLE 11: EUROPE ANTI-RHEUMATICS MARKET, BY DRUG CLASS, FORECAST YEARS, 2020-2028 (IN $ MILLION)
TABLE 12: EUROPE DISEASE MODIFYING ANTI-RHEUMATIC DRUGS MARKET, HISTORICAL YEARS, 2016-2019 (IN $ MILLION)
TABLE 13: EUROPE DISEASE MODIFYING ANTI-RHEUMATIC DRUGS MARKET, FORECAST YEARS, 2020-2028 (IN $ MILLION)
TABLE 14: EUROPE NONSTEROIDAL ANTI-INFLAMMATORY DRUGS MARKET, HISTORICAL YEARS, 2016-2019 (IN $ MILLION)
TABLE 15: EUROPE NONSTEROIDAL ANTI-INFLAMMATORY DRUGS MARKET, FORECAST YEARS, 2020-2028 (IN $ MILLION)
TABLE 16: EUROPE CORTICOSTEROIDS MARKET, HISTORICAL YEARS, 2016-2019 (IN $ MILLION)
TABLE 17: EUROPE CORTICOSTEROIDS MARKET, FORECAST YEARS, 2020-2028 (IN $ MILLION)
TABLE 18: EUROPE URIC ACID DRUGS MARKET, HISTORICAL YEARS, 2016-2019 (IN $ MILLION)
TABLE 19: EUROPE URIC ACID DRUGS MARKET, FORECAST YEARS, 2020-2028 (IN $ MILLION)
TABLE 20: EUROPE OTHER DRUG CLASS MARKET, HISTORICAL YEARS, 2016-2019 (IN $ MILLION)
TABLE 21: EUROPE OTHER DRUG CLASS MARKET, FORECAST YEARS, 2020-2028 (IN $ MILLION)
TABLE 22: EUROPE ANTI-RHEUMATICS MARKET, BY COUNTRY, HISTORICAL YEARS, 2016-2019 (IN $ MILLION)
TABLE 23: EUROPE ANTI-RHEUMATICS MARKET, BY COUNTRY, FORECAST YEARS, 2020-2028 (IN $ MILLION)
FIGURES LIST
FIGURE 1: PORTER’S FIVE FORCE ANALYSIS
FIGURE 2: OPPORTUNITY MATRIX
FIGURE 3: VENDOR LANDSCAPE
FIGURE 4: KEY INVESTMENT INSIGHTS
FIGURE 5: EUROPE ANTI-RHEUMATICS MARKET, BY TYPE, IN 2019
FIGURE 6: EUROPE ANTI-RHEUMATICS MARKET, BY PRESCRIPTION-BASED DRUGS, 2020-2028 (IN $ MILLION)
FIGURE 7: EUROPE ANTI-RHEUMATICS MARKET, BY OVER-THE-COUNTER DRUGS, 2020-2028 (IN $ MILLION)
FIGURE 8: EUROPE ANTI-RHEUMATICS MARKET, BY DRUG CLASS, IN 2019
FIGURE 9: EUROPE ANTI-RHEUMATICS MARKET, BY DISEASE MODIFYING ANTI-RHEUMATIC DRUGS, 2020-2028 (IN $ MILLION)
FIGURE 10: EUROPE ANTI-RHEUMATICS MARKET, BY NONSTEROIDAL ANTI-INFLAMMATORY DRUGS, 2020-2028 (IN $ MILLION)
FIGURE 11: EUROPE ANTI-RHEUMATICS MARKET, BY CORTICOSTEROIDS, 2020-2028 (IN $ MILLION)
FIGURE 12: EUROPE ANTI-RHEUMATICS MARKET, BY URIC ACID DRUGS, 2020-2028 (IN $ MILLION)
FIGURE 13: EUROPE ANTI-RHEUMATICS MARKET, BY OTHER DRUG CLASS, 2020-2028 (IN $ MILLION)
FIGURE 14: EUROPE ANTI-RHEUMATICS MARKET, COUNTRY OUTLOOK, 2019 & 2028 (IN %)
FIGURE 15: THE UNITED KINGDOM ANTI-RHEUMATICS MARKET, 2020-2028 (IN $ MILLION)
FIGURE 16: FRANCE ANTI-RHEUMATICS MARKET, 2020-2028 (IN $ MILLION)
FIGURE 17: GERMANY ANTI-RHEUMATICS MARKET, 2020-2028 (IN $ MILLION)
FIGURE 18: ITALY ANTI-RHEUMATICS MARKET, 2020-2028 (IN $ MILLION)
FIGURE 19: RUSSIA ANTI-RHEUMATICS MARKET, 2020-2028 (IN $ MILLION)
FIGURE 20: BELGIUM ANTI-RHEUMATICS MARKET, 2020-2028 (IN $ MILLION)
FIGURE 21: POLAND ANTI-RHEUMATICS MARKET, 2020-2028 (IN $ MILLION)
FIGURE 22: REST OF EUROPE ANTI-RHEUMATICS MARKET, 2020-2028 (IN $ MILLION)
- GEOGRAPHICAL ANALYSIS
- EUROPE
- THE UNITED KINGDOM
- FRANCE
- GERMANY
- ITALY
- RUSSIA
- BELGIUM
- POLAND
- REST OF EUROPE
- EUROPE
- MARKET BY TYPE
- PRESCRIPTION-BASED DRUGS
- OVER-THE-COUNTER DRUGS
- MARKET BY DRUG CLASS
- DISEASE MODIFYING ANTI-RHEUMATIC DRUGS
- NONSTEROIDAL ANTI-INFLAMMATORY DRUGS
- CORTICOSTEROIDS
- URIC ACID DRUGS
- OTHER DRUG CLASS
To request a free sample copy of this report, please complete the form below :
We offer 10% free customization including country-level data, niche applications and competitive landscape with every report.