GLOBAL E-BIKE MARKET FORECAST 2024-2032
SCOPE OF THE REPORT
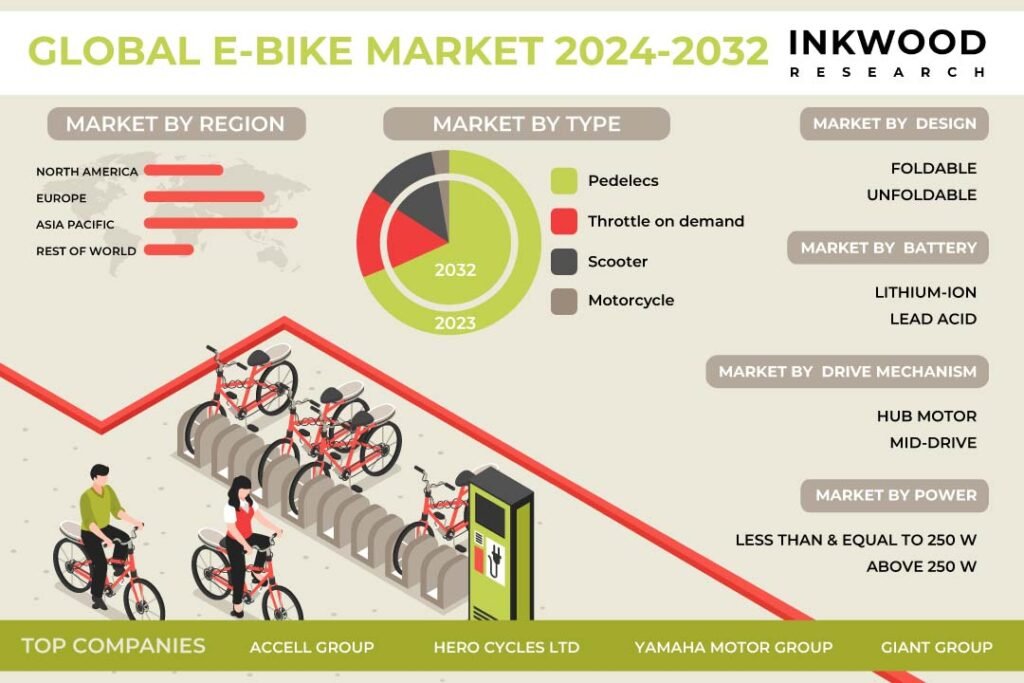
Global E-bike Market by Design (Foldable, Unfoldable) Market by Type (Pedelecs, Throttle on Demand, Scooters, Motorcycles) Market by Drive Mechanism (Hub Motor, Mid-drive) Market by Battery (Lithium-ion, Lead Acid) Market by Power (Less Than & Equal to 250 W, Above 250 W) by Geography
REPORTS » » » AUTOMOTIVE » AUTOMOTIVE TECHNOLOGY » GLOBAL E-BIKE MARKET FORECAST 2024-2032
MARKET OVERVIEW
According to Inkwood Research, the global e-bike market is projected to witness a CAGR of 11.37% during the forecast years of 2024 to 2032. The base year considered for the study is 2023, and the estimated period is between 2024 and 2032.
The global e-bike market entails electric bicycles that provide rechargeable battery-powered electric motors to assist with pedaling. By adding power on-demand, e-bikes address range anxiety, arrival sweat, and exertion concerns, which previously hindered mass cycling adoption for urban transportation. E-bikes retain the intrinsic environmental benefits of mobility without direct emissions while promoting daily physical activity through continued pedaling.
Rising fuel prices, traffic congestion and pollution in urban areas have driven consumer demand for affordable and sustainable mobility alternatives. Government subsidies and tax incentives that reduce upfront costs have further supplemented e-bike purchases. Dedicated cycling infrastructure investments also provide a strong incentive in progressive cities.
As batteries continue improving with greater power and range between charges, e-bikes can serve more demographics and trips while replacing higher emission options. With supportive charging infrastructure and policy frameworks, global volumes could continue seeing above-average growth versus traditional bicycles in high-density urban centers.
Read our latest blog on the E-Bike Market
GROWTH ENABLERS
Key growth enablers of the global e-bike market:
- Supportive government policies promoting sustainable transport options
- Growing consumer inclination towards eco-friendly commuting solutions
- Across urban centers worldwide, consumer mindsets have demonstrably shifted towards the adoption of sustainable and eco-friendly mobility alternatives aligned with environmental values. E-bikes present a promising solution granting benefits like reduced fossil fuel usage, decreased air and noise pollution, and walkable/bikeable city planning concessions.
- Consumers increasingly select e-bikes over private cars and motorcycles for short-range commuting and errands, given their zero direct emissions profile and intrinsic exercise benefits. From students to professionals, dense urban corporate campuses have installed charging infrastructure and instituted e-bike subsidy programs.
- Further augmented by policy incentives like purchase subsidies and usage expansion in public spaces, e-bikes enable carbon-neutral commuting at scale.
- With supportive infrastructure and technological improvements, environmentally conscious urban consumers will likely continue migrating portions of their mobility patterns to e-bikes. Mainstream consciousness of ecological impact and personal health may also position e-bikes for above-average growth versus the broader bicycle industry.
- Increased investments in connected infrastructure suitable for e-bikes
- Rapid technological progress makes e-bikes more advanced and affordable
- Rising fuel prices stimulate demand for cost-effective transportation
GROWTH RESTRAINTS
Key market growth restraining factors:
- High upfront costs of purchasing e-bikes
- Lack of cycling infrastructure hampers adoption in certain regions
- While e-bikes have achieved strong growth in select urban centers with mature biking ecosystems, adoption lags in many regions lacking dedicated infrastructure. The absence of safe cycling paths, signage, storage and charging facilities disincentivizes riders.
- Urban planners often overlook bike lanes with auto-centric designs. Similarly, regulations restricting access to public roads or spaces inhibit mainstreaming. Without physical infrastructure and policy support, concerns over road risks and theft deter e-bike purchases despite interest. Some countries trail leaders in Europe and China, constrained by limited infrastructure budgets.
- However, urbanization and sustainability policies have compelled cities to publish bike-friendly mobility plans targeting emission reductions. Pilot projects confirming usage validate investments in scaling up cycling access points. Achieving critical mass remains challenging without demonstrating adoption from initial infrastructure.
- Concerns related to e-bike’s safety features and liability requirements
- Limited consumer awareness restricts mainstream popularity
To Know More About This Report, Request a Free Sample Copy
KEY MARKET TRENDS
Global E-Bike Market | Top Trends- E-bike manufacturers are offering increasing levels of customization and personalization to match the diverse power, speed and range needs demanded by riders. Modular motor, battery and electronic control systems allow individual configurations aligned closely with intended riding style and terrain. Riders focused on raw power and torque for hill climbs can specify higher-powered motors and batteries with advanced thermal management. Commuters needing extended range can select larger batteries and more efficient pedal-assist modes. The flexibility caters across segments from urban riders to off-road enthusiasts.
- E-bike manufacturers increasingly select durable yet lightweight frame materials such as carbon fiber and aluminum alloys to enhance efficiency, speed and riding dynamics. Precision engineering of carbon fiber frames provides inherent vibration dampening for improved comfort along with strength-to-weight ratios outpacing metals. Brands also leverage innovative aluminum profiles and manufacturing techniques to construct durable and affordable frames with well-tuned rigidity, stiffness and compliance matching performance cues of carbon fiber. As motors and batteries evolve to provide greater power and range, minimizing frame weight directly optimizes acceleration, handling and battery duration per charge. Durable materials withstand daily commuting or off-road riding for years while delivering a more responsive and efficient ride.
MARKET SEGMENTATION
Market Segmentation – Design, Type, Drive Mechanism, Battery, and Power –
Market by Design:
- Foldable
- Foldable e-bike designs continue gaining share given convenience benefits suiting urban space constraints and multi-modal mobility. Compact folded sizes simplify storage, portability and transport, while quick folding mechanisms enable seamless transitions between riding modes. As urban floor space remains limited, demand has emerged for minimal footprint and freestanding bikes. Further, foldable e-bike adoption has been aided by the maturation of battery technology, allowing lighter designs without the range compromises of earlier models.
- Leading brands now offer foldable e-bikes spanning power configurations from compact commuters to cargo delivery models. While marginally priced higher than traditional counterparts, enhanced usefulness drives purchases from apartment dwellers and public transit users. As cities densify amidst urbanization trends, foldable e-bikes resolve practical barriers to ownership faced by subsections of riders. With designs and battery ranges now stretching mainstream, foldables will likely continue above-average industry growth. Their versatile attributes directly align with space-constrained mobility requirements of urban centers where e-bike adoption is concentrated.
- Unfoldable
Market by Type:
- Pedelecs
- Pedelecs, or pedal-assist e-bikes, have emerged as the fastest-growing type within the rapidly expanding global e-bike market. With pedelec systems, riders receive automated electric motor assists while pedaling up to a specified speed threshold, after which propulsion relies completely on human power.
- By augmenting rather than replacing pedaling, pedelecs strike a versatile balance between power and exercise. Further aided by the deregulation of access to roads and paths allowing motors under certain wattages, pedelecs lowered barriers for recreational and short-range transport adoption.
- Moreover, continued drivetrain innovations around optimizing motor power and responsiveness to human pedaling patterns broaden accessibility further. With improved battery capacities packing longer ranges in lightweight builds, pedelecs build upon intrinsic environmental and health benefits of cycling while mitigating concerns of overexertion or arrival sweat.
- As most mature e-bike technology with expanding real-world ranges matching commuting needs, pedelecs appear positioned for above-average industry growth in years ahead.
- Throttle On Demand
- Scooters
- Motorcycles
Market by Drive Mechanism:
- Hub Motor
- Mid-Drive
Market by Battery:
- Lithium-Ion
- Lead Acid
Market by Power:
- Less Than & Equal To 250 W
- Above 250 W
GEOGRAPHICAL STUDY
Geographical Study based on Four Major Regions:
- North America: The United States and Canada
- Europe: The United Kingdom, Germany, France, Italy, Spain, Belgium, Poland, and Rest of Europe
- Asia-Pacific: China, Japan, India, South Korea, Indonesia, Thailand, Vietnam, Australia & New Zealand, and Rest of Asia-Pacific
- Asia Pacific accounts for over three-fifths of global e-bike volume, led by early adoption in China, now extending to urban centers across India, Southeast Asia, Japan and Korea. Favorable demographic shifts like rising incomes and urbanization coupled with worsening air pollution, traffic congestion and space constraints have boosted e-bike uptake.
- Further supplemented by government purchase incentives, vehicle registration easing and dedicated cycling infrastructure investments, the region nurtures local brands like Yadea, Aima and Giant Manufacturing alongside Western entrants.
- Growth remains concentrated around dense Tier I cities where discharged lead-acid batteries get recycled in the same supply chain. Improving lithium-ion technology, rising ranges and falling prices will likely expand adoption deeper into Tier II regions.
- With Momentum Group acquiring Tokyo-based brand MiRider to enter the Japanese market and Hero Cycles aiming for leadership in India, the region is characterized by an early-mover advantage. Coupled with policy support, this positions the Asia-Pacific at the forefront of the industry for the coming years, especially as technology improvements expand applications.
- Rest of World: Latin America, the Middle East & Africa
MAJOR PLAYERS
Major players in the global e-bike market:
- Accell Group
- BionX International Corporation
- Robert Bosch GmbH
- Hero Cycles Ltd
- Yamaha Motor Group
Key strategies adopted by some of these companies:
- In January 2022, Accell Group acquired certain assets of spin-off Mobility Holdings, expanding its reach in the North American e-bike parts, accessories and service market. This allows Accell to provide support across the entire e-bike value chain.
- Hero Cycles, in February 2022, established a dedicated e-bike division consolidating research, engineering and branding operations under one roof to accelerate growth. By centralizing key functions, Hero aims to become a leader in the Indian e-bike market.
- Yamaha launched its newest PWseries ST mid-drive electric systems with increased torque, improved power-to-weight ratios and integrated removable batteries in September 2021. These modular systems enhance performance and convenience across Yamaha’s e-bike lineup.
REPORT SYNOPSIS
| REPORT SCOPE | DETAILS |
|---|---|
| Market Forecast Years | 2024-2032 |
| Base Year | 2023 |
| Market Historical Years | 2018-2022 |
| Forecast Units | Revenue ($ Million) |
| Segments Analyzed | Design, Type, Drive Mechanism, Battery, and Power |
| Geographies Analyzed | North America, Europe, Asia-Pacific, and Rest of World |
| Companies Analyzed | Accell Group, BionX International Corporation, Robert Bosch GmbH, Hero Cycles Ltd, Yamaha Motor Group, Derby Cycle Holding GmbH, Giant Group, Kwang Yang Motor Co Ltd, Merida & Centurion Germany GmbH (MCG), Samsung Electronics Co Ltd, Continental AG, Prodeco Technologies LLC, Tianjin Fuji-Ta Group Co Ltd, Trek Bicycle Corporation, Pedego Inc, Shimano Inc |
RESEARCH SCOPE & METHODOLOGY
- STUDY OBJECTIVES
- METHODOLOGY
- ASSUMPTIONS & LIMITATIONS
EXECUTIVE SUMMARY
- MARKET SIZE & ESTIMATES
- MARKET OVERVIEW
- SCOPE OF STUDY
- MAJOR MARKET FINDINGS
- RISING URBANIZATION AND EXPANDING CITY DENSITY DEMAND COMPACT MOBILITY WITH LOWER ENVIRONMENTAL IMPACT
- ELECTRIC MOUNTAIN BIKES GAINING TRACTION DUE TO RECREATIONAL ACTIVITIES AND ATHLEISURE PREFERENCES
- INCREASE IN CARGO E-BIKE ADOPTION FOR LAST-MILE DELIVERIES REFLECTS CHANGING RETAIL/LOGISTICS PRIORITIES
MARKET DYNAMICS
- KEY DRIVERS
- SUPPORTIVE GOVERNMENT POLICIES PROMOTING SUSTAINABLE TRANSPORT OPTIONS
- GROWING CONSUMER INCLINATION TOWARDS ECO-FRIENDLY COMMUTING SOLUTIONS
- INCREASED INVESTMENTS IN CONNECTED INFRASTRUCTURE SUITABLE FOR E-BIKES
- RAPID TECHNOLOGICAL PROGRESS MAKE E-BIKES MORE ADVANCED AND AFFORDABLE
- RISING FUEL PRICES STIMULATE DEMAND FOR COST-EFFECTIVE TRANSPORTATION
- KEY RESTRAINTS
- HIGH UPFRONT COSTS OF PURCHASING E-BIKES
- LACK OF CYCLING INFRASTRUCTURE HAMPERS ADOPTION IN CERTAIN REGIONS
- CONCERNS RELATED TO E-BIKE SAFETY FEATURES AND LIABILITY REQUIREMENTS
- LIMITED CONSUMER AWARENESS RESTRICTS MAINSTREAM POPULARITY
- KEY DRIVERS
KEY ANALYTICS
- KEY MARKET TRENDS
- CUSTOMIZATION FOR DIVERSE RIDING STYLES AND NEEDS LIKE POWER, SPEED, AND RANGE
- INCREASED USAGE OF LIGHTWEIGHT YET DURABLE FRAMES SUCH AS CARBON FIBER
- RISING EMPHASIS ON SWAPPABLE BATTERIES FOR LONGER DISTANCES
- PORTER’S FIVE FORCES ANALYSIS
- BUYERS POWER
- SUPPLIERS POWER
- SUBSTITUTION
- NEW ENTRANTS
- INDUSTRY RIVALRY
- GROWTH PROSPECT MAPPING
- GROWTH PROSPECT MAPPING FOR NORTH AMERICA
- GROWTH PROSPECT MAPPING FOR EUROPE
- GROWTH PROSPECT MAPPING FOR ASIA-PACIFIC
- GROWTH PROSPECT MAPPING FOR REST OF WORLD
- MARKET MATURITY ANALYSIS
- MARKET CONCENTRATION ANALYSIS
- VALUE CHAIN ANALYSIS
- COMPONENT SOURCING AND INTEGRATION
- DISTRIBUTION AND RETAIL CHANNELS
- TECHNOLOGICAL INNOVATION AND R&D
- AFTER-SALES SERVICES AND CUSTOMER SUPPORT
- KEY BUYING CRITERIA
- BATTERY PERFORMANCE AND RANGE
- TECHNOLOGY AND CONNECTIVITY FEATURES
- DESIGN AND BUILD QUALITY
- REGULATORY COMPLIANCE AND STANDARDS
- KEY MARKET TRENDS
MARKET BY DESIGN
- FOLDABLE
- MARKET FORECAST FIGURE
- SEGMENT ANALYSIS
- UNFOLDABLE
- MARKET FORECAST FIGURE
- SEGMENT ANALYSIS
- FOLDABLE
MARKET BY TYPE
- PEDELECS
- MARKET FORECAST FIGURE
- SEGMENT ANALYSIS
- THROTTLE ON DEMAND
- MARKET FORECAST FIGURE
- SEGMENT ANALYSIS
- SCOOTERS
- MARKET FORECAST FIGURE
- SEGMENT ANALYSIS
- MOTORCYCLES
- MARKET FORECAST FIGURE
- SEGMENT ANALYSIS
- PEDELECS
MARKET BY DRIVE MECHANISM
- HUB MOTOR
- MARKET FORECAST FIGURE
- SEGMENT ANALYSIS
- MID-DRIVE
- MARKET FORECAST FIGURE
- SEGMENT ANALYSIS
- HUB MOTOR
MARKET BY BATTERY
- LITHIUM-ION
- MARKET FORECAST FIGURE
- SEGMENT ANALYSIS
- LEAD ACID
- MARKET FORECAST FIGURE
- SEGMENT ANALYSIS
- LITHIUM-ION
MARKET BY POWER
- LESS THAN & EQUAL TO 250 W
- MARKET FORECAST FIGURE
- SEGMENT ANALYSIS
- ABOVE 250 W
- MARKET FORECAST FIGURE
- SEGMENT ANALYSIS
- LESS THAN & EQUAL TO 250 W
GEOGRAPHICAL ANALYSIS
- NORTH AMERICA
- MARKET SIZE & ESTIMATES
- NORTH AMERICA E-BIKE MARKET DRIVERS
- NORTH AMERICA E-BIKE MARKET CHALLENGES
- NORTH AMERICA E-BIKE MARKET REGULATORY FRAMEWORK
- KEY PLAYERS IN NORTH AMERICA E-BIKE MARKET
- COUNTRY ANALYSIS
- UNITED STATES
- UNITED STATES E-BIKE MARKET SIZE & OPPORTUNITIES
- CANADA
- CANADA E-BIKE MARKET SIZE & OPPORTUNITIES
- UNITED STATES
- EUROPE
- MARKET SIZE & ESTIMATES
- EUROPE E-BIKE MARKET DRIVERS
- EUROPE E-BIKE MARKET CHALLENGES
- EUROPE E-BIKE MARKET REGULATORY FRAMEWORK
- KEY PLAYERS IN EUROPE E-BIKE MARKET
- COUNTRY ANALYSIS
- UNITED KINGDOM
- UNITED KINGDOM E-BIKE MARKET SIZE & OPPORTUNITIES
- GERMANY
- GERMANY E-BIKE MARKET SIZE & OPPORTUNITIES
- FRANCE
- FRANCE E-BIKE MARKET SIZE & OPPORTUNITIES
- ITALY
- ITALY E-BIKE MARKET SIZE & OPPORTUNITIES
- SPAIN
- SPAIN E-BIKE MARKET SIZE & OPPORTUNITIES
- BELGIUM
- BELGIUM E-BIKE MARKET SIZE & OPPORTUNITIES
- POLAND
- POLAND E-BIKE MARKET SIZE & OPPORTUNITIES
- REST OF EUROPE
- REST OF EUROPE E-BIKE MARKET SIZE & OPPORTUNITIES
- UNITED KINGDOM
- ASIA-PACIFIC
- MARKET SIZE & ESTIMATES
- ASIA-PACIFIC E-BIKE MARKET DRIVERS
- ASIA-PACIFIC E-BIKE MARKET CHALLENGES
- ASIA-PACIFIC E-BIKE MARKET REGULATORY FRAMEWORK
- KEY PLAYERS IN ASIA-PACIFIC E-BIKE MARKET
- COUNTRY ANALYSIS
- CHINA
- CHINA E-BIKE MARKET SIZE & OPPORTUNITIES
- JAPAN
- JAPAN E-BIKE MARKET SIZE & OPPORTUNITIES
- INDIA
- INDIA E-BIKE MARKET SIZE & OPPORTUNITIES
- SOUTH KOREA
- SOUTH KOREA E-BIKE MARKET SIZE & OPPORTUNITIES
- THAILAND
- THAILAND E-BIKE MARKET SIZE & OPPORTUNITIES
- VIETNAM
- VIETNAM E-BIKE MARKET SIZE & OPPORTUNITIES
- INDONESIA
- INDONESIA E-BIKE MARKET SIZE & OPPORTUNITIES
- AUSTRALIA & NEW ZEALAND
- AUSTRALIA & NEW ZEALAND E-BIKE MARKET SIZE & OPPORTUNITIES
- REST OF ASIA-PACIFIC
- REST OF ASIA-PACIFIC E-BIKE MARKET SIZE & OPPORTUNITIES
- CHINA
- REST OF WORLD
- MARKET SIZE & ESTIMATES
- REST OF WORLD E-BIKE MARKET DRIVERS
- REST OF WORLD E-BIKE MARKET CHALLENGES
- REST OF WORLD E-BIKE REGULATORY FRAMEWORK
- KEY PLAYERS IN REST OF WORLD E-BIKE MARKET
- REGIONAL ANALYSIS
- LATIN AMERICA
- LATIN AMERICA E-BIKE MARKET SIZE & OPPORTUNITIES
- MIDDLE EAST & AFRICA
- MIDDLE EAST & AFRICA E-BIKE MARKET SIZE & OPPORTUNITIES
- LATIN AMERICA
- NORTH AMERICA
COMPETITIVE LANDSCAPE
- KEY STRATEGIC DEVELOPMENTS
- MERGERS & ACQUISITIONS
- PRODUCT LAUNCHES & DEVELOPMENTS
- PARTNERSHIPS & AGREEMENTS
- BUSINESS EXPANSIONS & DIVESTITURES
- COMPANY PROFILES
- ACCELL GROUP
- COMPANY OVERVIEW
- PRODUCT LIST
- STRENGTHS & CHALLENGES
- BIONX INTERNATIONAL CORPORATION
- COMPANY OVERVIEW
- PRODUCT LIST
- STRENGTHS & CHALLENGES
- ROBERT BOSCH GMBH
- COMPANY OVERVIEW
- PRODUCT LIST
- STRENGTHS & CHALLENGES
- HERO CYCLES LTD
- COMPANY OVERVIEW
- PRODUCT LIST
- STRENGTHS & CHALLENGES
- YAMAHA MOTOR GROUP
- COMPANY OVERVIEW
- PRODUCT LIST
- STRENGTHS & CHALLENGES
- DERBY CYCLE HOLDING GMBH
- COMPANY OVERVIEW
- PRODUCT LIST
- STRENGTHS & CHALLENGES
- GIANT GROUP
- COMPANY OVERVIEW
- PRODUCT LIST
- STRENGTHS & CHALLENGES
- KWANG YANG MOTOR CO LTD
- COMPANY OVERVIEW
- PRODUCTS LIST
- STRENGTHS & CHALLENGES
- MERIDA & CENTURION GERMANY GMBH (MCG)
- COMPANY OVERVIEW
- PRODUCT LIST
- STRENGTHS & CHALLENGES
- SAMSUNG ELECTRONICS CO LTD
- COMPANY OVERVIEW
- PRODUCTS LIST
- STRENGTHS & CHALLENGES
- CONTINENTAL AG
- COMPANY OVERVIEW
- PRODUCT LIST
- STRENGTHS & CHALLENGES
- PRODECO TECHNOLOGIES LLC
- COMPANY OVERVIEW
- PRODUCTS LIST
- STRENGTHS & CHALLENGES
- TIANJIN FUJI-TA GROUP CO LTD
- COMPANY OVERVIEW
- PRODUCT LIST
- STRENGTHS & CHALLENGES
- TREK BICYCLE CORPORATION
- COMPANY OVERVIEW
- PRODUCT LIST
- STRENGTHS & CHALLENGES
- PEDEGO INC
- COMPANY OVERVIEW
- PRODUCT LIST
- STRENGTHS & CHALLENGES
- SHIMANO INC
- COMPANY OVERVIEW
- PRODUCT LIST
- STRENGTHS & CHALLENGES
- ACCELL GROUP
- KEY STRATEGIC DEVELOPMENTS
LIST OF TABLES
TABLE 1: MARKET SNAPSHOT – E-BIKE MARKET
TABLE 2: GLOBAL E-BIKE MARKET, BY DESIGN, HISTORICAL YEARS, 2018-2022 (IN $ MILLION)
TABLE 3: GLOBAL E-BIKE MARKET, BY DESIGN, FORECAST YEARS, 2024-2032 (IN $ MILLION)
TABLE 4: GLOBAL FOLDABLE MARKET, BY REGION, HISTORICAL YEARS, 2018-2022 (IN $ MILLION)
TABLE 5: GLOBAL FOLDABLE MARKET, BY REGION, FORECAST YEARS, 2024-2032 (IN $ MILLION)
TABLE 6: GLOBAL UNFOLDABLE MARKET, BY REGION, HISTORICAL YEARS, 2018-2022 (IN $ MILLION)
TABLE 7: GLOBAL UNFOLDABLE MARKET, BY REGION, FORECAST YEARS, 2024-2032 (IN $ MILLION)
TABLE 8: GLOBAL E-BIKE MARKET, BY TYPE, HISTORICAL YEARS, 2018-2022 (IN $ MILLION)
TABLE 9: GLOBAL E-BIKE MARKET, BY TYPE, FORECAST YEARS, 2024-2032 (IN $ MILLION)
TABLE 10: GLOBAL PEDELECS MARKET, BY REGION, HISTORICAL YEARS, 2018-2022 (IN $ MILLION)
TABLE 11: GLOBAL PEDELECS MARKET, BY REGION, FORECAST YEARS, 2024-2032 (IN $ MILLION)
TABLE 12: GLOBAL THROTTLE ON DEMAND MARKET, BY REGION, HISTORICAL YEARS, 2018-2022 (IN $ MILLION)
TABLE 13: GLOBAL THROTTLE ON DEMAND MARKET, BY REGION, FORECAST YEARS, 2024-2032 (IN $ MILLION)
TABLE 14: GLOBAL SCOOTERS MARKET, BY REGION, HISTORICAL YEARS, 2018-2022 (IN $ MILLION)
TABLE 15: GLOBAL SCOOTERS MARKET, BY REGION, FORECAST YEARS, 2024-2032 (IN $ MILLION)
TABLE 16: GLOBAL MOTORCYCLES MARKET, BY REGION, HISTORICAL YEARS, 2018-2022 (IN $ MILLION)
TABLE 17: GLOBAL MOTORCYCLES MARKET, BY REGION, FORECAST YEARS, 2024-2032 (IN $ MILLION)
TABLE 18: GLOBAL E-BIKE MARKET, BY DRIVE MECHANISM, HISTORICAL YEARS, 2018-2022 (IN $ MILLION)
TABLE 19: GLOBAL E-BIKE MARKET, BY DRIVE MECHANISM, FORECAST YEARS, 2024-2032 (IN $ MILLION)
TABLE 20: GLOBAL HUB MOTOR MARKET, BY REGION, HISTORICAL YEARS, 2018-2022 (IN $ MILLION)
TABLE 21: GLOBAL HUB MOTOR MARKET, BY REGION, FORECAST YEARS, 2024-2032 (IN $ MILLION)
TABLE 22: GLOBAL MID-DRIVE MARKET, BY REGION, HISTORICAL YEARS, 2018-2022 (IN $ MILLION)
TABLE 23: GLOBAL MID-DRIVE MARKET, BY REGION, FORECAST YEARS, 2024-2032 (IN $ MILLION)
TABLE 24: GLOBAL E-BIKE MARKET, BY BATTERY, HISTORICAL YEARS, 2018-2022 (IN $ MILLION)
TABLE 25: GLOBAL E-BIKE MARKET, BY BATTERY, FORECAST YEARS, 2024-2032 (IN $ MILLION)
TABLE 26: GLOBAL LITHIUM-ION MARKET, BY REGION, HISTORICAL YEARS, 2018-2022 (IN $ MILLION)
TABLE 27: GLOBAL LITHIUM-ION MARKET, BY REGION, FORECAST YEARS, 2024-2032 (IN $ MILLION)
TABLE 28: GLOBAL LEAD ACID MARKET, BY REGION, HISTORICAL YEARS, 2018-2022 (IN $ MILLION)
TABLE 29: GLOBAL LEAD ACID MARKET, BY REGION, FORECAST YEARS, 2024-2032 (IN $ MILLION)
TABLE 30: GLOBAL E-BIKE MARKET, BY POWER, HISTORICAL YEARS, 2018-2022 (IN $ MILLION)
TABLE 31: GLOBAL E-BIKE MARKET, BY POWER, FORECAST YEARS, 2024-2032 (IN $ MILLION)
TABLE 32: GLOBAL LESS THAN & EQUAL TO 250 W MARKET, BY REGION, HISTORICAL YEARS, 2018-2022 (IN $ MILLION)
TABLE 33: GLOBAL LESS THAN & EQUAL TO 250 W MARKET, BY REGION, FORECAST YEARS, 2024-2032 (IN $ MILLION)
TABLE 34: GLOBAL ABOVE 250 W MARKET, BY REGION, HISTORICAL YEARS, 2018-2022 (IN $ MILLION)
TABLE 35: GLOBAL ABOVE 250 W MARKET, BY REGION, FORECAST YEARS, 2024-2032 (IN $ MILLION)
TABLE 36: GLOBAL E-BIKE MARKET, BY GEOGRAPHY, HISTORICAL YEARS, 2018-2022 (IN $ MILLION)
TABLE 37: GLOBAL E-BIKE MARKET, BY GEOGRAPHY, FORECAST YEARS, 2024-2032 (IN $ MILLION)
TABLE 38: NORTH AMERICA E-BIKE MARKET, BY COUNTRY, HISTORICAL YEARS, 2018-2022 (IN $ MILLION)
TABLE 39: NORTH AMERICA E-BIKE MARKET, BY COUNTRY, FORECAST YEARS, 2024-2032 (IN $ MILLION)
TABLE 40: NORTH AMERICA E-BIKE MARKET REGULATORY FRAMEWORK
TABLE 41: KEY PLAYERS OPERATING IN NORTH AMERICA E-BIKE MARKET
TABLE 42: EUROPE E-BIKE MARKET, BY COUNTRY, HISTORICAL YEARS, 2018-2022 (IN $ MILLION)
TABLE 43: EUROPE E-BIKE MARKET, BY COUNTRY, FORECAST YEARS, 2024-2032 (IN $ MILLION)
TABLE 44: EUROPE E-BIKE MARKET REGULATORY FRAMEWORK
TABLE 45: KEY PLAYERS OPERATING IN EUROPE E-BIKE MARKET
TABLE 46: ASIA-PACIFIC E-BIKE MARKET, BY COUNTRY, HISTORICAL YEARS, 2018-2022 (IN $ MILLION)
TABLE 47: ASIA-PACIFIC E-BIKE MARKET, BY COUNTRY, FORECAST YEARS, 2024-2032 (IN $ MILLION)
TABLE 48: ASIA-PACIFIC E-BIKE MARKET REGULATORY FRAMEWORK
TABLE 49: KEY PLAYERS OPERATING IN ASIA-PACIFIC E-BIKE MARKET
TABLE 50: REST OF WORLD E-BIKE MARKET, BY REGION, HISTORICAL YEARS, 2018-2022 (IN $ MILLION)
TABLE 51: REST OF WORLD E-BIKE MARKET, BY REGION, FORECAST YEARS, 2024-2032 (IN $ MILLION)
TABLE 52: REST OF WORLD E-BIKE MARKET REGULATORY FRAMEWORK
TABLE 53: KEY PLAYERS OPERATING IN REST OF WORLD E-BIKE MARKET
TABLE 54: LIST OF MERGERS & ACQUISITIONS
TABLE 55: LIST OF PRODUCT LAUNCHES & DEVELOPMENTS
TABLE 56: LIST OF PARTNERSHIPS & AGREEMENTS
TABLE 57: LIST OF BUSINESS EXPANSIONS & DIVESTITURES
LIST OF FIGURES
FIGURE 1: KEY MARKET TRENDS
FIGURE 2: PORTER’S FIVE FORCES ANALYSIS
FIGURE 3: GROWTH PROSPECT MAPPING FOR NORTH AMERICA
FIGURE 4: GROWTH PROSPECT MAPPING FOR EUROPE
FIGURE 5: GROWTH PROSPECT MAPPING FOR ASIA-PACIFIC
FIGURE 6: GROWTH PROSPECT MAPPING FOR REST OF WORLD
FIGURE 7: MARKET MATURITY ANALYSIS
FIGURE 8: MARKET CONCENTRATION ANALYSIS
FIGURE 9: GLOBAL E-BIKE MARKET, GROWTH POTENTIAL, BY DESIGN, IN 2023
FIGURE 10: GLOBAL E-BIKE MARKET, BY FOLDABLE, 2024-2032 (IN $ MILLION)
FIGURE 11: GLOBAL E-BIKE MARKET, BY UNFOLDABLE, 2024-2032 (IN $ MILLION)
FIGURE 12: GLOBAL E-BIKE MARKET, GROWTH POTENTIAL, BY TYPE, IN 2023
FIGURE 13: GLOBAL E-BIKE MARKET, BY PEDELECS, 2024-2032 (IN $ MILLION)
FIGURE 14: GLOBAL E-BIKE MARKET, BY THROTTLE ON DEMAND, 2024-2032 (IN $ MILLION)
FIGURE 15: GLOBAL E-BIKE MARKET, BY SCOOTERS, 2024-2032 (IN $ MILLION)
FIGURE 16: GLOBAL E-BIKE MARKET, BY MOTORCYCLES, 2024-2032 (IN $ MILLION)
FIGURE 17: GLOBAL E-BIKE MARKET, GROWTH POTENTIAL, BY DRIVE MECHANISM, IN 2023
FIGURE 18: GLOBAL E-BIKE MARKET, BY HUB MOTOR, 2024-2032 (IN $ MILLION)
FIGURE 19: GLOBAL E-BIKE MARKET, BY MID-DRIVE, 2024-2032 (IN $ MILLION)
FIGURE 20: GLOBAL E-BIKE MARKET, GROWTH POTENTIAL, BY BATTERY, IN 2023
FIGURE 21: GLOBAL E-BIKE MARKET, BY LITHIUM-ION, 2024-2032 (IN $ MILLION)
FIGURE 22: GLOBAL E-BIKE MARKET, BY LEAD ACID, 2024-2032 (IN $ MILLION)
FIGURE 23: GLOBAL E-BIKE MARKET, GROWTH POTENTIAL, BY POWER, IN 2023
FIGURE 24: GLOBAL E-BIKE MARKET, BY LESS THAN & EQUAL TO 250 W, 2024-2032 (IN $ MILLION)
FIGURE 25: GLOBAL E-BIKE MARKET, BY ABOVE 250 W, 2024-2032 (IN $ MILLION)
FIGURE 26: NORTH AMERICA E-BIKE MARKET, COUNTRY OUTLOOK, 2023 & 2032 (IN %)
FIGURE 27: UNITED STATES E-BIKE MARKET, 2024-2032 (IN $ MILLION)
FIGURE 28: CANADA E-BIKE MARKET, 2024-2032 (IN $ MILLION)
FIGURE 29: EUROPE E-BIKE MARKET, COUNTRY OUTLOOK, 2023 & 2032 (IN %)
FIGURE 30: UNITED KINGDOM E-BIKE MARKET, 2024-2032 (IN $ MILLION)
FIGURE 31: GERMANY E-BIKE MARKET, 2024-2032 (IN $ MILLION)
FIGURE 32: FRANCE E-BIKE MARKET, 2024-2032 (IN $ MILLION)
FIGURE 33: ITALY E-BIKE MARKET, 2024-2032 (IN $ MILLION)
FIGURE 34: SPAIN E-BIKE MARKET, 2024-2032 (IN $ MILLION)
FIGURE 35: BELGIUM E-BIKE MARKET, 2024-2032 (IN $ MILLION)
FIGURE 36: POLAND E-BIKE MARKET, 2024-2032 (IN $ MILLION)
FIGURE 37: REST OF EUROPE E-BIKE MARKET, 2024-2032 (IN $ MILLION)
FIGURE 38: ASIA-PACIFIC E-BIKE MARKET, COUNTRY OUTLOOK, 2023 & 2032 (IN %)
FIGURE 39: CHINA E-BIKE MARKET, 2024-2032 (IN $ MILLION)
FIGURE 40: JAPAN E-BIKE MARKET, 2024-2032 (IN $ MILLION)
FIGURE 41: INDIA E-BIKE MARKET, 2024-2032 (IN $ MILLION)
FIGURE 42: SOUTH KOREA E-BIKE MARKET, 2024-2032 (IN $ MILLION)
FIGURE 43: THAILAND E-BIKE MARKET, 2024-2032 (IN $ MILLION)
FIGURE 44: VIETNAM E-BIKE MARKET, 2024-2032 (IN $ MILLION)
FIGURE 45: INDONESIA E-BIKE MARKET, 2024-2032 (IN $ MILLION)
FIGURE 46: AUSTRALIA & NEW ZEALAND E-BIKE MARKET, 2024-2032 (IN $ MILLION)
FIGURE 47: REST OF ASIA-PACIFIC E-BIKE MARKET, 2024-2032 (IN $ MILLION)
FIGURE 48: REST OF WORLD E-BIKE MARKET, REGIONAL OUTLOOK, 2023 & 2032 (IN %)
FIGURE 49: LATIN AMERICA E-BIKE MARKET, 2024-2032 (IN $ MILLION)
FIGURE 50: MIDDLE EAST & AFRICA E-BIKE MARKET, 2024-2032 (IN $ MILLION)
FAQ’s
FAQs
An e-bike, or electric bike, is a bicycle equipped with an electric motor that assists the rider in pedaling. A rechargeable battery, providing an extra boost to make cycling easier and more efficient, can power it.
E-bikes typically have a maximum speed that varies by model and local regulations. In various regions, the motor assistance cuts off when the bike reaches speeds of around 20-28 miles per hour (32-45 kilometers per hour).
Yes, there are various types of e-bikes catering to different preferences and purposes. Common types include commuter e-bikes, mountain e-bikes, folding e-bikes, and cargo e-bikes. Each type is designed to meet specific needs, such as commuting, off-road cycling, or carrying heavy loads.
RELATED REPORTS
-
UNITED STATES E-BIKE MARKET FORECAST 2024-2032
-
CHINA E-BIKE MARKET FORECAST 2024-2032
-
GERMANY E-BIKE MARKET FORECAST 2024-2032
-
GLOBAL ELECTRIC VEHICLE POWER INVERTER MARKET FORECAST 2024-2032
-
FRANCE ELECTRIC VEHICLE POWER INVERTER MARKET FORECAST 2024-2032
-
JAPAN ELECTRIC VEHICLE POWER INVERTER MARKET FORECAST 2024-2032
-
SOUTH KOREA ELECTRIC VEHICLE POWER INVERTER MARKET FORECAST 2024-2032
-
GERMANY ELECTRIC VEHICLE POWER INVERTER MARKET FORECAST 2024-2032
-
UNITED STATES ELECTRIC VEHICLE POWER INVERTER MARKET FORECAST 2024-2032
-
CHINA ELECTRIC VEHICLE POWER INVERTER MARKET FORECAST 2024-2032