
GLOBAL COMPLAINT MANAGEMENT SOFTWARE MARKET FORECAST 2020-2028
Global Complaint Management Software Market by Component (Software, Service) by Type (Integrated, Stand-alone) by Deployment (on Premises, Cloud) by Industrial Vertical (Bfsi, Retail, Government & Public Sector, It & Telecom, Hospitality, Healthcare, Others) and by Geography.
Inkwood Research estimates that the global complaint management software market was valued at $xx billion in 2019, and is expected to reach $48.61 billion by 2028, growing at a CAGR of 10.46% during the forecast period. The base year considered for the market study is 2019, and the forecasted period is between 2020-2028.
The global complaint management software market growth is driven by:
- Need to increase customer satisfaction and protect brand reputation
- Increasing automated workflow and complaint management operations
Complaint management software is being adopted by various industrial verticals, due to the growing need to increase and improve customer satisfaction and for protecting their brand name by inspecting and answering the complaints in a timely manner. Further, there is a rise in adopt customer-centric strategies among companies to achieve greater customer satisfaction. These factors propel the adoption so as to address and resolve the complaints in an efficient manner, and to ensure positive customer experience for retaining brand reputation.
The government & public sector is the leading segment in terms of revenue in the global complaint management software market with around 26.44% market share in 2019. In recent years, several governments across the world have attempted to use direct and indirect reforms of complaint handling strategies as one way to enhance accountability. Poor complaint management leads to dissatisfied citizens and undermines public confidence. Further, it could indicate a poorly controlled and inefficient organization. Thus, the government sector uses complaint management software, which facilitates the landscape of complaint handling in public services and key priorities for regulatory authorities.
Moreover, the healthcare segment is anticipated to grow at the highest CAGR of around 12.22% during the forecast period. The growing demand for IT solutions among clinicians and healthcare professionals, which assists them in enhancing the quality of patient care at affordable prices, drives the demand for complaint management software in the healthcare industry. The substantial need to integrate patient information and health data across disparate systems and applications is expected to drive the demand of the market during the forecast period.
On the other hand, the global complaint management software market growth is restricted by insufficient useful data to resolve customer complaints. The lack of availability of data provided by customers to understand a problem so as to offer the appropriate solutions and resolve their complaints, hinders the growth of the market. However, for a better understanding of complaints and vendors, the market players are trying to develop mandatory data fields that need to be filled by customers to overcome this restraint during the forecast period.
The report scope of the global complaint management software market covers segmentation analysis of component, type, deployment mode, and industrial vertical.
Market by Component:
- Software
- Services
Market by Deployment Mode:
- On-premises
- On-demand
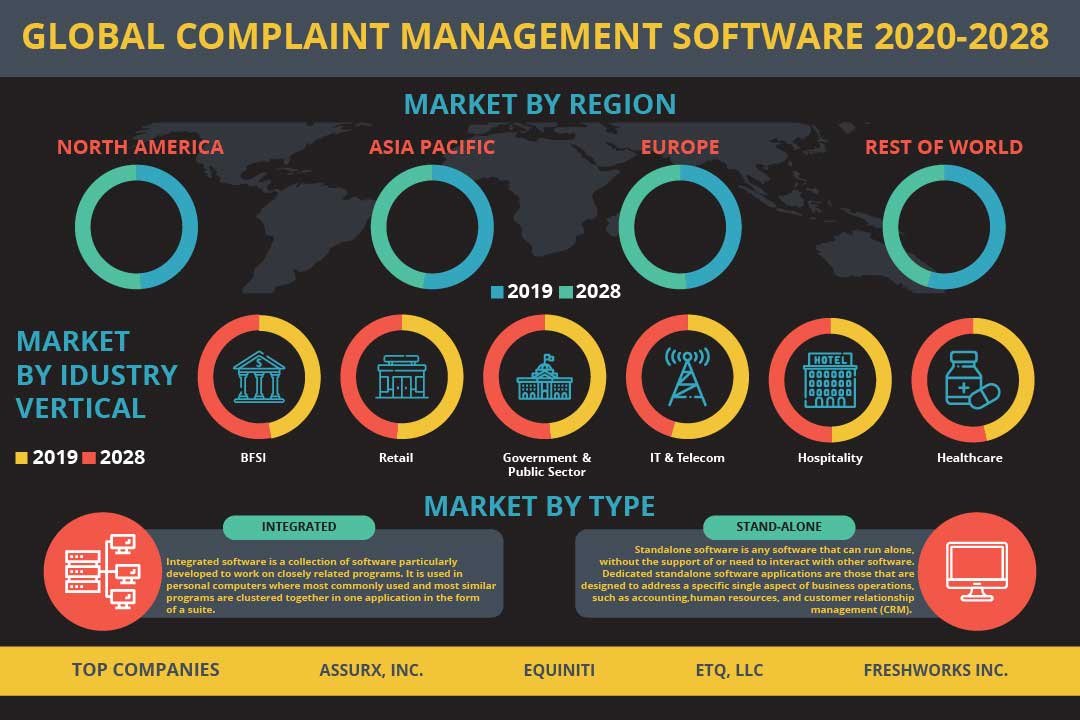
Market by Type:
- Integrated
- Stand-alone
Market by Industry Vertical:
- BFSI
- Retail
- Government & Public Sector
- IT & Telecom
- Hospitality
- Healthcare
- Others
On the basis of geography, the global complaint management software market has been segmented into four major regions:
- North America: the United States and Canada
- Europe: the United Kingdom, Germany, France, Italy, Russia, Belgium, Poland, and Rest of Europe
- Asia-Pacific: China, Japan, India, South Korea, Indonesia, Thailand, Vietnam, Australia & New Zealand, and Rest of Asia Pacific
- Rest of World: Latin America, the Middle East & Africa
Geographically, North America is the largest market with a market share of 39.72% in terms of revenue in 2019. The dominance of North America is attributed to the presence of major vendors, and the accessibility of proficient technical expertise that offers solutions in the region. These include Oracle Corporation, Mastercontrol Inc, Quantivate LLC, Freshworks Inc, and others. The accessibility of this software on mobile devices such as smartphones and tablets is expected to boost the growth of the market in the region. The adoption of complaint management software has increased over time in this region as the platform enables financial institutions to streamline their current operations and incorporate additional features and advanced functionality, which provides numerous opportunities for the market.
On the other hand, Asia Pacific is anticipated to be the fastest-growing region with a CAGR of xx% during the forecast period. The growth is attributed to the increasing adoption of business intelligence & machine learning across various sectors, increasing internet penetration, along with the growing BFSI sector & healthcare expenditure, and the increasing investments in the market. There are many SMEs and start-up companies operating in the region that prefers cloud-enabled software, since it is less costly compared to on-premise software solutions.
The key players involved in the global complaint management software market are:
- Oracle Corporation
- AssurX Inc
- Equiniti
- Freshworks Inc
- com Inc
- Others
In May 2019, Zendesk Inc announced the expansion of Zendesk Sunshine, its CRM platform built on AWS. This expansion includes delivering deep insights about the customers to improve customer experiences.
Key findings of the global complaint management software market:
- North America leads the market by capturing the largest market share of around 39.72% in 2019.
- The Asia Pacific market is anticipated to grow at the highest CAGR of xx% during the forecast period, 2020-2028.
- The cloud based solutions are facing increasing demands in the market.
- The integration of new technologies such as AI and NLP in complaint management software is surging the market growth.
- RESEARCH SCOPE & METHODOLOGY
- STUDY OBJECTIVES
- SCOPE OF STUDY
- METHODOLOGY
- ASSUMPTIONS & LIMITATIONS
- EXECUTIVE SUMMARY
- MARKET SIZE & ESTIMATES
- MARKET OVERVIEW
- MARKET DYNAMICS
- MARKET DEFINITION
- KEY DRIVERS
- NEED TO PROTECT BRAND REPUTATION AND INCREASE CUSTOMER SATISFACTION
- RISE IN NEED OF AUTOMATED WORKFLOW AND STREAMLINED COMPLAINT MANAGEMENT OPERATION
- KEY RESTRAINTS
- INSUFFICIENT USEFUL DATA TO RESOLVE CUSTOMER COMPLAINTS
- KEY ANALYTICS
- KEY INVESTMENT INSIGHTS
- PORTER’S FIVE FORCE ANALYSIS
- BUYER POWER
- SUPPLIER POWER
- SUBSTITUTION
- NEW ENTRANTS
- INDUSTRY RIVALRY
- OPPORTUNITY MATRIX
- VENDOR LANDSCAPE
- MARKET BY COMPONENT
- SOFTWARE
- SERVICE
- MARKET BY TYPE
- INTEGRATED
- STAND-ALONE
- MARKET BY DEPLOYMENT
- ON PREMISES
- CLOUD
- MARKET BY INDUSTRIAL VERTICAL
- BFSI
- RETAIL
- GOVERNMENT & PUBLIC SECTOR
- IT & TELECOM
- HOSPITALITY
- HEALTHCARE
- OTHERS
- GEOGRAPHICAL ANALYSIS
- NORTH AMERICA
- UNITED STATES
- CANADA
- EUROPE
- UNITED KINGDOM
- GERMANY
- FRANCE
- ITALY
- RUSSIA
- BELGIUM
- POLAND
- REST OF EUROPE
- ASIA PACIFIC
- CHINA
- JAPAN
- INDIA
- SOUTH KOREA
- INDONESIA
- THAILAND
- VIETNAM
- AUSTRALIA & NEW ZEALAND
- REST OF ASIA PACIFIC
- REST OF WORLD
- LATIN AMERICA
- MIDDLE EAST & AFRICA
- NORTH AMERICA
- COMPANY PROFILES
- ASSURX INC
- EQUINITI
- ETQ LLC
- FRESHWORKS INC
- MASTERCONTROL INC
- ORACLE CORPORATION
- QUANTIVATE LLC
- COM INC
- SPARTA SYSTEMS INC
- ZENDESK INC
- ZOHO CORPORATION PVT LTD
LIST OF TABLES
TABLE 1: MARKET SNAPSHOT – COMPLAINT MANAGEMENT SOFTWARE
TABLE 2: GLOBAL COMPLAINT MANAGEMENT SOFTWARE MARKET, BY COMPONENT, HISTORICAL YEARS, 2016-2019 (IN $ MILLION)
TABLE 3: GLOBAL COMPLAINT MANAGEMENT SOFTWARE MARKET, BY COMPONENT, FORECAST YEARS, 2020-2028 (IN $ MILLION)
TABLE 4: GLOBAL SOFTWARE MARKET, BY REGION, HISTORICAL YEARS, 2016-2019 (IN $ MILLION)
TABLE 5: GLOBAL SOFTWARE MARKET, BY REGION, FORECAST YEARS, 2020-2028 (IN $ MILLION)
TABLE 6: GLOBAL SERVICE MARKET, BY REGION, HISTORICAL YEARS, 2016-2019 (IN $ MILLION)
TABLE 7: GLOBAL SERVICE MARKET, BY REGION, FORECAST YEARS, 2020-2028 (IN $ MILLION)
TABLE 8: GLOBAL COMPLAINT MANAGEMENT SOFTWARE MARKET, BY TYPE, HISTORICAL YEARS, 2016-2019 (IN $ MILLION)
TABLE 9: GLOBAL COMPLAINT MANAGEMENT SOFTWARE MARKET, BY TYPE, FORECAST YEARS, 2020-2028 (IN $ MILLION)
TABLE 10: GLOBAL INTEGRATED MARKET, BY REGION, HISTORICAL YEARS, 2016-2019 (IN $ MILLION)
TABLE 11: GLOBAL INTEGRATED MARKET, BY REGION, FORECAST YEARS, 2020-2028 (IN $ MILLION)
TABLE 12: GLOBAL STAND-ALONE MARKET, BY REGION, HISTORICAL YEARS, 2016-2019 (IN $ MILLION)
TABLE 13: GLOBAL STAND-ALONE MARKET, BY REGION, FORECAST YEARS, 2020-2028 (IN $ MILLION)
TABLE 14: GLOBAL COMPLAINT MANAGEMENT SOFTWARE MARKET, BY DEPLOYMENT, HISTORICAL YEARS, 2016-2019 (IN $ MILLION)
TABLE 15: GLOBAL COMPLAINT MANAGEMENT SOFTWARE MARKET, BY DEPLOYMENT, FORECAST YEARS, 2020-2028 (IN $ MILLION)
TABLE 16: GLOBAL ON PREMISES MARKET, BY REGION, HISTORICAL YEARS, 2016-2019 (IN $ MILLION)
TABLE 17: GLOBAL ON PREMISES MARKET, BY REGION, FORECAST YEARS, 2020-2028 (IN $ MILLION)
TABLE 18: GLOBAL CLOUD MARKET, BY REGION, HISTORICAL YEARS, 2016-2019 (IN $ MILLION)
TABLE 19: GLOBAL CLOUD MARKET, BY REGION, FORECAST YEARS, 2020-2028 (IN $ MILLION)
TABLE 20: GLOBAL COMPLAINT MANAGEMENT SOFTWARE MARKET, BY INDUSTRIAL VERTICAL, HISTORICAL YEARS, 2016-2019 (IN $ MILLION)
TABLE 21: GLOBAL COMPLAINT MANAGEMENT SOFTWARE MARKET, BY INDUSTRIAL VERTICAL, FORECAST YEARS, 2020-2028 (IN $ MILLION)
TABLE 22: GLOBAL BFSI MARKET, BY REGION, HISTORICAL YEARS, 2016-2019 (IN $ MILLION)
TABLE 23: GLOBAL BFSI MARKET, BY REGION, FORECAST YEARS, 2020-2028 (IN $ MILLION)
TABLE 24: GLOBAL RETAIL MARKET, BY REGION, HISTORICAL YEARS, 2016-2019 (IN $ MILLION)
TABLE 25: GLOBAL RETAIL MARKET, BY REGION, FORECAST YEARS, 2020-2028 (IN $ MILLION)
TABLE 26: GLOBAL GOVERNMENT & PUBLIC SECTOR MARKET, BY REGION, HISTORICAL YEARS, 2016-2019 (IN $ MILLION)
TABLE 27: GLOBAL GOVERNMENT & PUBLIC SECTOR MARKET, BY REGION, FORECAST YEARS, 2020-2028 (IN $ MILLION)
TABLE 28: GLOBAL IT & TELECOM MARKET, BY REGION, HISTORICAL YEARS, 2016-2019 (IN $ MILLION)
TABLE 29: GLOBAL IT & TELECOM MARKET, BY REGION, FORECAST YEARS, 2020-2028 (IN $ MILLION)
TABLE 30: GLOBAL HOSPITALITY MARKET, BY REGION, HISTORICAL YEARS, 2016-2019 (IN $ MILLION)
TABLE 31: GLOBAL HOSPITALITY MARKET, BY REGION, FORECAST YEARS, 2020-2028 (IN $ MILLION)
TABLE 32: GLOBAL HEALTHCARE MARKET, BY REGION, HISTORICAL YEARS, 2016-2019 (IN $ MILLION)
TABLE 33: GLOBAL HEALTHCARE MARKET, BY REGION, FORECAST YEARS, 2020-2028 (IN $ MILLION)
TABLE 34: GLOBAL OTHERS MARKET, BY REGION, HISTORICAL YEARS, 2016-2019 (IN $ MILLION)
TABLE 35: GLOBAL OTHERS MARKET, BY REGION, FORECAST YEARS, 2020-2028 (IN $ MILLION)
TABLE 36: GLOBAL COMPLAINT MANAGEMENT SOFTWARE MARKET, BY GEOGRAPHY, HISTORICAL YEARS, 2016-2019 (IN $ MILLION)
TABLE 37: GLOBAL COMPLAINT MANAGEMENT SOFTWARE MARKET, BY GEOGRAPHY, FORECAST YEARS, 2020-2028 (IN $ MILLION)
TABLE 38: NORTH AMERICA COMPLAINT MANAGEMENT SOFTWARE MARKET, BY COUNTRY, HISTORICAL YEARS, 2016-2019 (IN $ MILLION)
TABLE 39: NORTH AMERICA COMPLAINT MANAGEMENT SOFTWARE MARKET, BY COUNTRY, FORECAST YEARS, 2020-2028 (IN $ MILLION)
TABLE 40: EUROPE COMPLAINT MANAGEMENT SOFTWARE MARKET, BY COUNTRY, HISTORICAL YEARS, 2016-2019 (IN $ MILLION)
TABLE 41: EUROPE COMPLAINT MANAGEMENT SOFTWARE MARKET, BY COUNTRY, FORECAST YEARS, 2020-2028 (IN $ MILLION)
TABLE 42: ASIA PACIFIC COMPLAINT MANAGEMENT SOFTWARE MARKET, BY COUNTRY, HISTORICAL YEARS, 2016-2019 (IN $ MILLION)
TABLE 43: ASIA PACIFIC COMPLAINT MANAGEMENT SOFTWARE MARKET, BY COUNTRY, FORECAST YEARS, 2020-2028 (IN $ MILLION)
TABLE 44: REST OF WORLD COMPLAINT MANAGEMENT SOFTWARE MARKET, BY REGION, HISTORICAL YEARS, 2016-2019 (IN $ MILLION)
TABLE 45: REST OF WORLD COMPLAINT MANAGEMENT SOFTWARE MARKET, BY REGION, FORECAST YEARS, 2020-2028 (IN $ MILLION)
LIST OF FIGURES
FIGURE 1: KEY INVESTMENT INSIGHTS
FIGURE 2: PORTER’S FIVE FORCE ANALYSIS
FIGURE 3: OPPORTUNITY MATRIX
FIGURE 4: VENDOR LANDSCAPE
FIGURE 5: GLOBAL COMPLAINT MANAGEMENT SOFTWARE MARKET, GROWTH POTENTIAL, BY COMPONENT, IN 2019
FIGURE 6: GLOBAL COMPLAINT MANAGEMENT SOFTWARE MARKET, BY SOFTWARE, 2020-2028 (IN $ MILLION)
FIGURE 7: GLOBAL COMPLAINT MANAGEMENT SOFTWARE MARKET, BY SERVICE, 2020-2028 (IN $ MILLION)
FIGURE 8: GLOBAL COMPLAINT MANAGEMENT SOFTWARE MARKET, GROWTH POTENTIAL, BY TYPE, IN 2019
FIGURE 9: GLOBAL COMPLAINT MANAGEMENT SOFTWARE MARKET, BY INTEGRATED, 2020-2028 (IN $ MILLION)
FIGURE 10: GLOBAL COMPLAINT MANAGEMENT SOFTWARE MARKET, BY STAND-ALONE, 2020-2028 (IN $ MILLION)
FIGURE 11: GLOBAL COMPLAINT MANAGEMENT SOFTWARE MARKET, GROWTH POTENTIAL, BY DEPLOYMENT, IN 2019
FIGURE 12: GLOBAL COMPLAINT MANAGEMENT SOFTWARE MARKET, BY ON PREMISES, 2020-2028 (IN $ MILLION)
FIGURE 13: GLOBAL COMPLAINT MANAGEMENT SOFTWARE MARKET, BY CLOUD, 2020-2028 (IN $ MILLION)
FIGURE 14: GLOBAL COMPLAINT MANAGEMENT SOFTWARE MARKET, GROWTH POTENTIAL, BY INDUSTRIAL VERTICAL, IN 2019
FIGURE 15: GLOBAL COMPLAINT MANAGEMENT SOFTWARE MARKET, BY BFSI, 2020-2028 (IN $ MILLION)
FIGURE 16: GLOBAL COMPLAINT MANAGEMENT SOFTWARE MARKET, BY RETAIL, 2020-2028 (IN $ MILLION)
FIGURE 17: GLOBAL COMPLAINT MANAGEMENT SOFTWARE MARKET, BY GOVERNMENT & PUBLIC SECTOR, 2020-2028 (IN $ MILLION)
FIGURE 18: GLOBAL COMPLAINT MANAGEMENT SOFTWARE MARKET, BY IT & TELECOM, 2020-2028 (IN $ MILLION)
FIGURE 19: GLOBAL COMPLAINT MANAGEMENT SOFTWARE MARKET, BY HOSPITALITY, 2020-2028 (IN $ MILLION)
FIGURE 20: GLOBAL COMPLAINT MANAGEMENT SOFTWARE MARKET, BY HEALTHCARE, 2020-2028 (IN $ MILLION)
FIGURE 21: GLOBAL COMPLAINT MANAGEMENT SOFTWARE MARKET, BY OTHERS, 2020-2028 (IN $ MILLION)
FIGURE 22: NORTH AMERICA COMPLAINT MANAGEMENT SOFTWARE MARKET, REGIONAL OUTLOOK, 2019 & 2028 (IN %)
FIGURE 23: UNITED STATES COMPLAINT MANAGEMENT SOFTWARE MARKET, 2020-2028 (IN $ MILLION)
FIGURE 24: CANADA COMPLAINT MANAGEMENT SOFTWARE MARKET, 2020-2028 (IN $ MILLION)
FIGURE 25: EUROPE COMPLAINT MANAGEMENT SOFTWARE MARKET, REGIONAL OUTLOOK, 2019 & 2028 (IN %)
FIGURE 26: UNITED KINGDOM COMPLAINT MANAGEMENT SOFTWARE MARKET, 2020-2028 (IN $ MILLION)
FIGURE 27: GERMANY COMPLAINT MANAGEMENT SOFTWARE MARKET, 2020-2028 (IN $ MILLION)
FIGURE 28: FRANCE COMPLAINT MANAGEMENT SOFTWARE MARKET, 2020-2028 (IN $ MILLION)
FIGURE 29: ITALY COMPLAINT MANAGEMENT SOFTWARE MARKET, 2020-2028 (IN $ MILLION)
FIGURE 30: RUSSIA COMPLAINT MANAGEMENT SOFTWARE MARKET, 2020-2028 (IN $ MILLION)
FIGURE 31: BELGIUM COMPLAINT MANAGEMENT SOFTWARE MARKET, 2020-2028 (IN $ MILLION)
FIGURE 32: POLAND COMPLAINT MANAGEMENT SOFTWARE MARKET, 2020-2028 (IN $ MILLION)
FIGURE 33: REST OF EUROPE COMPLAINT MANAGEMENT SOFTWARE MARKET, 2020-2028 (IN $ MILLION)
FIGURE 34: ASIA PACIFIC COMPLAINT MANAGEMENT SOFTWARE MARKET, REGIONAL OUTLOOK, 2019 & 2028 (IN %)
FIGURE 35: CHINA COMPLAINT MANAGEMENT SOFTWARE MARKET, 2020-2028 (IN $ MILLION)
FIGURE 36: JAPAN COMPLAINT MANAGEMENT SOFTWARE MARKET, 2020-2028 (IN $ MILLION)
FIGURE 37: INDIA COMPLAINT MANAGEMENT SOFTWARE MARKET, 2020-2028 (IN $ MILLION)
FIGURE 38: SOUTH KOREA COMPLAINT MANAGEMENT SOFTWARE MARKET, 2020-2028 (IN $ MILLION)
FIGURE 39: INDONESIA COMPLAINT MANAGEMENT SOFTWARE MARKET, 2020-2028 (IN $ MILLION)
FIGURE 40: THAILAND COMPLAINT MANAGEMENT SOFTWARE MARKET, 2020-2028 (IN $ MILLION)
FIGURE 41: VIETNAM COMPLAINT MANAGEMENT SOFTWARE MARKET, 2020-2028 (IN $ MILLION)
FIGURE 42: AUSTRALIA & NEW ZEALAND COMPLAINT MANAGEMENT SOFTWARE MARKET, 2020-2028 (IN $ MILLION)
FIGURE 43: REST OF ASIA PACIFIC COMPLAINT MANAGEMENT SOFTWARE MARKET, 2020-2028 (IN $ MILLION
FIGURE 44: REST OF WORLD COMPLAINT MANAGEMENT SOFTWARE MARKET, REGIONAL OUTLOOK, 2019 & 2028 (IN %)
FIGURE 45: LATIN AMERICA COMPLAINT MANAGEMENT SOFTWARE MARKET, 2020-2028 (IN $ MILLION)
FIGURE 46: MIDDLE EAST & AFRICA COMPLAINT MANAGEMENT SOFTWARE MARKET, 2020-2028 (IN $ MILLION)
- MARKET BY COMPONENT
- SOFTWARE
- SERVICE
- MARKET BY TYPE
- INTEGRATED
- STAND-ALONE
- MARKET BY DEPLOYMENT
- ON PREMISES
- CLOUD
- MARKET BY INDUSTRIAL VERTICAL
- BFSI
- RETAIL
- GOVERNMENT & PUBLIC SECTOR
- IT & TELECOM
- HOSPITALITY
- HEALTHCARE
- OTHERS
- GEOGRAPHICAL ANALYSIS
- NORTH AMERICA
- UNITED STATES
- CANADA
- EUROPE
- UNITED KINGDOM
- GERMANY
- FRANCE
- ITALY
- RUSSIA
- BELGIUM
- POLAND
- REST OF EUROPE
- ASIA PACIFIC
- CHINA
- JAPAN
- INDIA
- SOUTH KOREA
- INDONESIA
- THAILAND
- VIETNAM
- AUSTRALIA & NEW ZEALAND
- REST OF ASIA PACIFIC
- REST OF WORLD
- LATIN AMERICA
- MIDDLE EAST & AFRICA
- NORTH AMERICA
To request a free sample copy of this report, please complete the form below :
We offer 10% free customization including country-level data, niche applications and competitive landscape with every report.