GLOBAL ACTIVATED CARBON MARKET FORECAST 2023-2032
SCOPE OF THE REPORT
Global Activated Carbon Market by Product Type (Powdered Activated Carbon, Granulated Activated Carbon, Other Product Types) Market by Raw Material (Coal, Coconut Shell, Wood, Other Raw Materials) Market by End-user (Water Treatment, Food & Beverage, Pharmaceutical and Medical, Automotive, Air Purification, Other End-users) by Geography.
REPORTS » CHEMICALS AND MATERIALS » SPECIALTY MATERIALS » GLOBAL ACTIVATED CARBON MARKET FORECAST 2023-2032
MARKET OVERVIEW
In terms of revenue, the global activated carbon market was valued at $xx million in 2022 and is estimated to reach $xx million by 2032. Moreover, the market is expected to progress with a CAGR of 7.20% in terms of revenue and xx% in terms of volume during the forecast period, 2023 to 2032.
Also known as activated charcoal, activated carbon is generated by processing organic material with a high carbon content, thus making it extremely porous. Activated carbon collects and absorbs organic compounds from vapor and liquid, subsequently cleansing them of undesirable substances.
The material is used for a wide range of activities, including the recovery and purification of the environment. Strict regulations in response to growing environmental concerns have prompted several manufacturers to invest in advanced technologies, such as Activated Carbon Injection (ACI), primarily used to control mercury in industrial and electric-generating plants.
Read our latest blog on the Activated Carbon Market
GROWTH ENABLERS
Key growth enablers of the global activated carbon market:
- Rising demand for water and sewage treatments
- The continually surging population drives consumer demand for safe drinking water, thereby raising the need for water filtration.
- Moreover, the increasing need for water treatment techniques in response to stringent laws and regulations, such as the National Minimum Standard (MINAS) in India, is a major factor anticipated to fuel the activated carbon market growth.
- Furthermore, according to recent research, AI methods have been effective in chlorination control and membrane filtration processes. This helps save up to 30% on operational expenditures by optimizing chemical use for treatment, reducing energy costs, and aiding proactive asset maintenance.
- Accelerating demand for mercury control applications
- Extensive usage of activated carbon in the pharmaceutical and healthcare industries
- Resurgence of the auto industry
GROWTH RESTRAINTS
Key growth restraining factors:
- Scarcity of raw materials
- Activated coconut charcoal is made by burning coconut shells at very high heat. This makes the material porous and ideal to be used for water filtration. However, a high preference for coconut shells as a raw material can lead to price hikes in the case of a shortage in coconut shell production.
- Fluctuations in crude oil prices have also negatively affected several industries. Aligning with this, the widespread usage of activated carbon in chemical and petrochemical industries can be severely impacted by fluctuations in crude oil prices.
To Know More About This Report, Request a Free Sample Copy
KEY MARKET TRENDS
Global Activated Carbon Market | Key Market Trends
- The Mercury and Air Toxics Standards (MATS) of the United States Environmental Protection Agency (EPA), a provision of the Clean Air Act, has established limits on the amount of mercury and other toxins that power plants are permitted to emit. This factor has escalated the demand for air filtration systems like commercial HVAC air filters and HEPA filters used in conjunction with activated carbon.
- The revival of the automotive industry plays an essential role in propelling the demand for activated carbon. In this regard, vehicles use activated carbon canisters to reduce hydrocarbon emissions and improve engine performance, as well.
- In light of the COVID-19 pandemic, there has been a significant increase in demand for personal protective equipment (PPE), such as masks with activated carbon filters, due to which market participants are focusing on the healthcare sector.
MARKET SEGMENTATION
Market Segmentation – Product Type, Raw Material, and End-User –
Market by Product Type:
- Powdered Activated Carbon (PAC)
- Granulated Activated Carbon (GAC)
- Granulated activated carbon (GAC) is highly demanded by several end-use industries like air and gas purification and water treatment. Easy regeneration and reusability are primarily responsible for the overall growth of the segment.
- Moreover, the product’s ability to diffuse faster enables its widespread usage in gas absorption. Since granulated activated carbon is larger in size compared to PAC, the larger surface area per unit volume facilitates higher absorption.
- Other Product Types
Market by Raw Material:
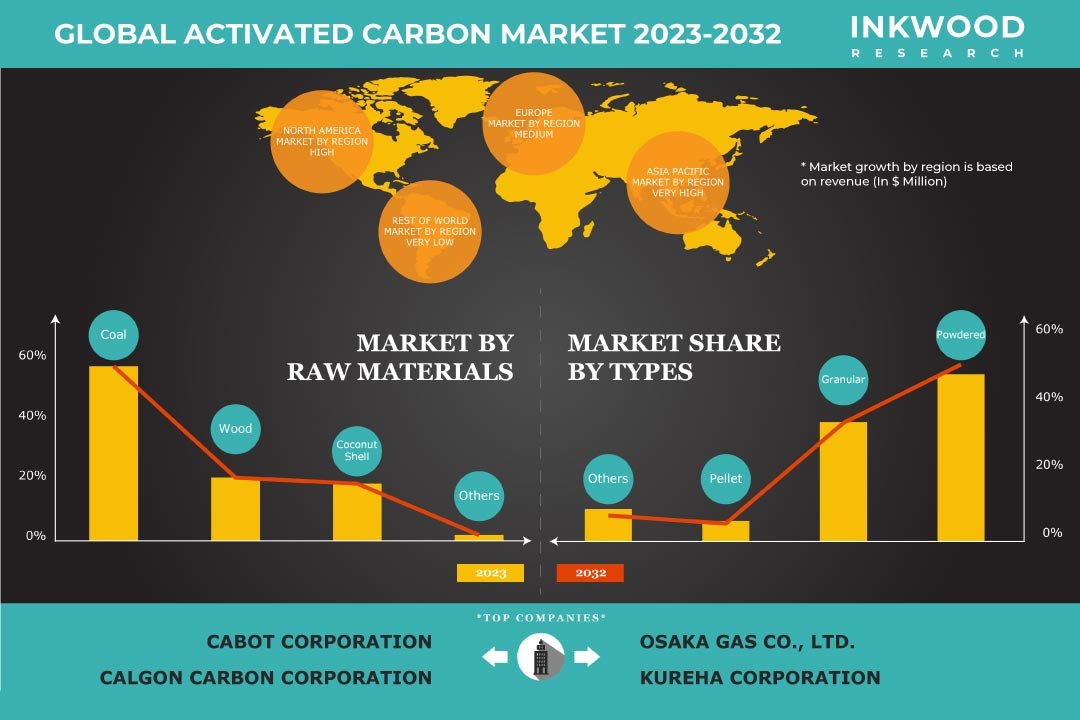
- Coal
- Coal is expected to be the dominating raw material in terms of revenue and volume during the forecast period.
- The demand for coal-based activated carbon is high, primarily on account of its low cost.
- Coconut Shell
- Wood
- Other Raw Materials
Market by End-User:
- Water Treatment
- The water treatment segment is projected to be the major end-user over the forecast period, in terms of both revenue and volume, mainly due to the increase in industrial activities.
- The demand for wastewater treatment systems is on the rise owing to the decline in natural resources and an increase in pollutants. These water filtration plants use activated carbon filters to remove inorganic and synthetic organic chemicals.
- Key advancements like ultra-concentrated products, high-efficiency side stream filtration, and advanced bacteria warning systems are also incorporated in several industries, including chemicals, paint and dyes, and others, in order to reduce industrial pollution.
- Food & Beverage
- Pharmaceutical and Medical
- Automotive
- Air Purification
- Other End-Users
GEOGRAPHICAL STUDY
Geographical Study Based on Four Major Regions:
- North America: The United States and Canada
- Europe: The United Kingdom, Germany, France, Italy, Spain, and Rest of Europe
- Asia-Pacific: China, Japan, India, South Korea, Australia, and Rest of Asia-Pacific
- Asia-Pacific is set to lead and dominate the global activated carbon market over the projection period.
- Activated carbon is created from carbonaceous sources like bamboo, willow peat, coconut husk, wood, lignite, coal, coir, and petroleum pitch. Asia-Pacific is a popular market for coconut shells and is sourced from Asian nations like India, Sri Lanka, Indonesia, and the Philippines.
- Countries such as China and India are the major consumers of activated carbon, primarily for water treatment purposes. Consequently, the rise in population in these nations has led to increasing demand for clean and safe water, thus propelling the demand for activated charcoal in the Asia-Pacific.
- Rest of World: Latin America, the Middle East & Africa
MAJOR PLAYERS
Major players in the global activated carbon market:
- Silcarbon Atkivkohle GmbH
- Prominent Systems Inc
- Oxbow Activated Carbon LLC
- Osaka Gas Co Ltd
- Kureha Corporation
- Kuraray Co Ltd
- Haycarb PLC
- Donau Carbon GmbH
- Cabot Corporation
- BASF SE
Key strategies adopted by some of these companies:
- In June 2022, Calgon Carbon, as well as ChartWater’s AdEdge Center of Excellence, signed an agreement to collaborate in providing drinking water treatment systems to rural, under-resourced communities.
- Kuraray signed a multi-year capacity reservation agreement in June 2022 to purchase sustainable carbon-negative material from Origin Materials. The company aims to create novel goods and cleaner technologies to improve the environment.
- Cabot Corporation has completely integrated its processes for obtaining raw materials, in addition to making products and distributing them. This strategy allows the company to reduce the risk associated with sourcing raw materials and stringent quality standards on production.
REPORT SYNOPSIS
| REPORT SCOPE | DETAILS |
|---|---|
| Market Forecast Years | 2023-2032 |
| Base Year | 2022 |
| Market Historical Years | 2018-2022 |
| Forecast Units | Revenue ($ Million) |
| Segments Analyzed | Product, Application, End-User |
| Geographies Analyzed | North America, Europe, Asia-Pacific, and Rest of World |
| Companies Analyzed | Prime Medical LLC, STERIS PLC, Aspen Surgical, Xodus Medical, Smith & Nephew PLC, Geneva Enterprises, Ansell Ltd, Universal Medical, Cardinal Health, Symmetry Surgical |
TABLE OF CONTENT
RESEARCH SCOPE & METHODOLOGY
- STUDY OBJECTIVES
- SCOPE OF STUDY
- METHODOLOGY
- ASSUMPTIONS & LIMITATIONS
EXECUTIVE SUMMARY
- MARKET SIZE & ESTIMATES
- MARKET OVERVIEW
MARKET DYNAMICS
- KEY DRIVERS
- RISING DEMAND FOR WATER AND SEWAGE TREATMENTS
- ACCELERATING DEMAND FOR MERCURY CONTROL APPLICATIONS
- EXTENSIVE USAGE OF ACTIVATED CARBON IN THE PHARMACEUTICAL AND HEALTHCARE INDUSTRIES
- RESURGENCE OF THE AUTO INDUSTRY
- KEY RESTRAINTS
- SCARCITY OF RAW MATERIALS
- KEY DRIVERS
KEY ANALYTICS
- IMPACT OF COVID-19 ON ACTIVATED CARBON MARKET
- KEY MARKET TRENDS
- PORTER’S FIVE FORCES ANALYSIS
- BUYERS POWER
- SUPPLIERS POWER
- SUBSTITUTION
- NEW ENTRANTS
- INDUSTRY RIVALRY
- OPPORTUNITY MATRIX
- VENDOR LANDSCAPE
- KEY BUYING CRITERIA
- REGULATORY FRAMEWORK
MARKET BY PRODUCT TYPE (IN TERMS OF REVENUE: $ MILLION & IN TERMS OF VOLUME: KILOTONS)
- POWDERED ACTIVATED CARBON (PAC)
- GRANULATED ACTIVATED CARBON (GAC)
- OTHER PRODUCT TYPES
MARKET BY RAW MATERIAL (IN TERMS OF REVENUE: $ MILLION & IN TERMS OF VOLUME: KILOTONS)
- COAL
- COCONUT SHELL
- WOOD
- OTHER RAW MATERIALS
MARKET BY END-USER (IN TERMS OF REVENUE: $ MILLION & IN TERMS OF VOLUME: KILOTONS)
- WATER TREATMENT
- FOOD & BEVERAGE
- PHARMACEUTICAL AND MEDICAL
- AUTOMOTIVE
- AIR PURIFICATION
- OTHER END-USERS
GEOGRAPHICAL ANALYSIS
- NORTH AMERICA
- MARKET SIZE & ESTIMATES
- KEY GROWTH ENABLERS
- KEY CHALLENGES
- KEY PLAYERS
- COUNTRY ANALYSIS
- UNITED STATES
- CANADA
- EUROPE
- MARKET SIZE & ESTIMATES
- KEY GROWTH ENABLERS
- KEY CHALLENGES
- KEY PLAYERS
- COUNTRY ANALYSIS
- UNITED KINGDOM
- GERMANY
- FRANCE
- ITALY
- SPAIN
- REST OF EUROPE
- ASIA-PACIFIC
- MARKET SIZE & ESTIMATES
- KEY GROWTH ENABLERS
- KEY CHALLENGES
- KEY PLAYERS
- COUNTRY ANALYSIS
- CHINA
- JAPAN
- INDIA
- SOUTH KOREA
- AUSTRALIA
- REST OF ASIA-PACIFIC
- REST OF WORLD
- MARKET SIZE & ESTIMATES
- KEY GROWTH ENABLERS
- KEY CHALLENGES
- KEY PLAYERS
- REGIONAL ANALYSIS
- LATIN AMERICA
- MIDDLE EAST & AFRICA
- NORTH AMERICA
COMPETITIVE LANDSCAPE
- KEY STRATEGIC DEVELOPMENTS
- MERGERS & ACQUISITIONS
- PRODUCT LAUNCHES & DEVELOPMENTS
- PARTNERSHIPS & AGREEMENTS
- BUSINESS EXPANSIONS & DIVESTITURES
- COMPANY PROFILES
- BASF SE
- CABOT CORPORATION
- DONAU CARBON GMBH
- HAYCARB PLC
- KURARAY CO LTD
- KUREHA CORPORATION
- OSAKA GAS CO LTD
- OXBOW ACTIVATED CARBON LLC
- PROMINENT SYSTEMS INC
- SILCARBON ATKIVKOHLE GMBH
- KEY STRATEGIC DEVELOPMENTS
LIST OF TABLES
TABLE 1: MARKET SNAPSHOT – ACTIVATED CARBON
TABLE 2: REGULATORY FRAMEWORK
TABLE 3: GLOBAL ACTIVATED CARBON MARKET, BY PRODUCT TYPE, HISTORICAL YEARS, 2018-2021 (IN $ MILLION)
TABLE 4: GLOBAL ACTIVATED CARBON MARKET, BY PRODUCT TYPE, FORECAST YEARS, 2023-2032 (IN $ MILLION)
TABLE 5: GLOBAL ACTIVATED CARBON MARKET, BY PRODUCT TYPE, HISTORICAL YEARS, 2018-2021 (IN KILOTONS)
TABLE 6: GLOBAL ACTIVATED CARBON MARKET, BY PRODUCT TYPE, FORECAST YEARS, 2023-2032 (IN KILOTONS)
TABLE 7: GLOBAL POWDERED ACTIVATED CARBON (PAC) MARKET, BY REGION, HISTORICAL YEARS, 2018-2021 (IN $ MILLION)
TABLE 8: GLOBAL POWDERED ACTIVATED CARBON (PAC) MARKET, BY REGION, FORECAST YEARS, 2023-2032 (IN $ MILLION)
TABLE 9: GLOBAL GRANULATED ACTIVATED CARBON (GAC) MARKET, BY REGION, HISTORICAL YEARS, 2018-2021 (IN $ MILLION)
TABLE 10: GLOBAL GRANULATED ACTIVATED CARBON (GAC) MARKET, BY REGION, FORECAST YEARS, 2023-2032 (IN $ MILLION)
TABLE 11: GLOBAL OTHER PRODUCT TYPES MARKET, BY REGION, HISTORICAL YEARS, 2018-2021 (IN $ MILLION)
TABLE 12: GLOBAL OTHER PRODUCT TYPES MARKET, BY REGION, FORECAST YEARS, 2023-2032 (IN $ MILLION)
TABLE 13: GLOBAL ACTIVATED CARBON MARKET, BY RAW MATERIAL, HISTORICAL YEARS, 2018-2021 (IN $ MILLION)
TABLE 14: GLOBAL ACTIVATED CARBON MARKET, BY RAW MATERIAL, FORECAST YEARS, 2023-2032 (IN $ MILLION)
TABLE 15: GLOBAL ACTIVATED CARBON MARKET, BY RAW MATERIAL, HISTORICAL YEARS, 2018-2021 (IN KILOTONS)
TABLE 16: GLOBAL ACTIVATED CARBON MARKET, BY RAW MATERIAL, FORECAST YEARS, 2023-2032 (IN KILOTONS)
TABLE 17: GLOBAL COAL MARKET, BY REGION, HISTORICAL YEARS, 2018-2021 (IN $ MILLION)
TABLE 18: GLOBAL COAL MARKET, BY REGION, FORECAST YEARS, 2023-2032 (IN $ MILLION)
TABLE 19: GLOBAL COCONUT SHELL MARKET, BY REGION, HISTORICAL YEARS, 2018-2021 (IN $ MILLION)
TABLE 20: GLOBAL COCONUT SHELL MARKET, BY REGION, FORECAST YEARS, 2023-2032 (IN $ MILLION)
TABLE 21: GLOBAL WOOD MARKET, BY REGION, HISTORICAL YEARS, 2018-2021 (IN $ MILLION)
TABLE 22: GLOBAL WOOD MARKET, BY REGION, FORECAST YEARS, 2023-2032 (IN $ MILLION)
TABLE 23: GLOBAL OTHER RAW MATERIALS MARKET, BY REGION, HISTORICAL YEARS, 2018-2021 (IN $ MILLION)
TABLE 24: GLOBAL OTHER RAW MATERIALS MARKET, BY REGION, FORECAST YEARS, 2023-2032 (IN $ MILLION)
TABLE 25: GLOBAL ACTIVATED CARBON MARKET, BY END-USER, HISTORICAL YEARS, 2018-2021 (IN $ MILLION)
TABLE 26: GLOBAL ACTIVATED CARBON MARKET, BY END-USER, FORECAST YEARS, 2023-2032 (IN $ MILLION)
TABLE 27: GLOBAL ACTIVATED CARBON MARKET, BY END-USER, HISTORICAL YEARS, 2018-2021 (IN KILOTONS)
TABLE 28: GLOBAL ACTIVATED CARBON MARKET, BY END-USER, FORECAST YEARS, 2023-2032 (IN KILOTONS)
TABLE 29: GLOBAL WATER TREATMENT MARKET, BY REGION, HISTORICAL YEARS, 2018-2021 (IN $ MILLION)
TABLE 30: GLOBAL WATER TREATMENT MARKET, BY REGION, FORECAST YEARS, 2023-2032 (IN $ MILLION)
TABLE 31: GLOBAL FOOD & BEVERAGE MARKET, BY REGION, HISTORICAL YEARS, 2018-2021 (IN $ MILLION)
TABLE 32: GLOBAL FOOD & BEVERAGE MARKET, BY REGION, FORECAST YEARS, 2023-2032 (IN $ MILLION)
TABLE 33: GLOBAL PHARMACEUTICAL AND MEDICAL COMPANIES MARKET, BY REGION, HISTORICAL YEARS, 2018-2021 (IN $ MILLION)
TABLE 34: GLOBAL PHARMACEUTICAL AND MEDICAL COMPANIES MARKET, BY REGION, FORECAST YEARS, 2023-2032 (IN $ MILLION)
TABLE 35: GLOBAL AUTOMOTIVE MARKET, BY REGION, HISTORICAL YEARS, 2018-2021 (IN $ MILLION)
TABLE 36: GLOBAL AUTOMOTIVE MARKET, BY REGION, FORECAST YEARS, 2023-2032 (IN $ MILLION)
TABLE 37: GLOBAL AIR PURIFICATION MARKET, BY REGION, HISTORICAL YEARS, 2018-2021 (IN $ MILLION)
TABLE 38: GLOBAL AIR PURIFICATION MARKET, BY REGION, FORECAST YEARS, 2023-2032 (IN $ MILLION)
TABLE 39: GLOBAL OTHER END-USERS MARKET, BY REGION, HISTORICAL YEARS, 2018-2021 (IN $ MILLION)
TABLE 40: GLOBAL OTHER END-USERS MARKET, BY REGION, FORECAST YEARS, 2023-2032 (IN $ MILLION)
TABLE 41: NORTH AMERICA ACTIVATED CARBON MARKET, BY COUNTRY, HISTORICAL YEARS, 2018-2021 (IN $ MILLION)
TABLE 42: NORTH AMERICA ACTIVATED CARBON MARKET, BY COUNTRY, FORECAST YEARS, 2023-2032 (IN $ MILLION)
TABLE 43: LEADING PLAYERS OPERATING IN NORTH AMERICA ACTIVATED CARBON MARKET
TABLE 44: EUROPE ACTIVATED CARBON MARKET, BY COUNTRY, HISTORICAL YEARS, 2018-2021 (IN $ MILLION)
TABLE 45: EUROPE ACTIVATED CARBON MARKET, BY COUNTRY, FORECAST YEARS, 2023-2032 (IN $ MILLION)
TABLE 46: LEADING PLAYERS OPERATING IN EUROPE ACTIVATED CARBON MARKET
TABLE 47: ASIA-PACIFIC ACTIVATED CARBON MARKET, BY COUNTRY, HISTORICAL YEARS, 2018-2021 (IN $ MILLION)
TABLE 48: ASIA-PACIFIC ACTIVATED CARBON MARKET, BY COUNTRY, FORECAST YEARS, 2023-2032 (IN $ MILLION)
TABLE 49: LEADING PLAYERS OPERATING IN ASIA-PACIFIC ACTIVATED CARBON MARKET
TABLE 50: REST OF WORLD ACTIVATED CARBON MARKET, BY REGION, HISTORICAL YEARS, 2018-2021 (IN $ MILLION)
TABLE 51: REST OF WORLD ACTIVATED CARBON MARKET, BY REGION, FORECAST YEARS, 2023-2032 (IN $ MILLION)
TABLE 52: LEADING PLAYERS OPERATING IN REST OF WORLD ACTIVATED CARBON MARKET
TABLE 53: LIST OF MERGERS & ACQUISITIONS
TABLE 54: LIST OF PRODUCT LAUNCHES & DEVELOPMENTS
TABLE 55: LIST OF PARTNERSHIPS & AGREEMENTS
TABLE 56: LIST OF BUSINESS EXPANSIONS & DIVESTITURES
LIST OF FIGURES
FIGURE 1: KEY MARKET TRENDS
FIGURE 2: PORTER’S FIVE FORCES ANALYSIS
FIGURE 3: OPPORTUNITY MATRIX
FIGURE 4: VENDOR LANDSCAPE
FIGURE 5: KEY BUYING CRITERIA
FIGURE 6: GLOBAL ACTIVATED CARBON MARKET, GROWTH POTENTIAL, BY PRODUCT TYPE, IN 2022
FIGURE 7: GLOBAL ACTIVATED CARBON MARKET, BY POWDERED ACTIVATED CARBON (PAC), 2023-2032 (IN $ MILLION)
FIGURE 8: GLOBAL ACTIVATED CARBON MARKET, BY GRANULATED ACTIVATED CARBON (GAC), 2023-2032 (IN $ MILLION)
FIGURE 9: GLOBAL ACTIVATED CARBON MARKET, BY OTHER PRODUCT TYPES, 2023-2032 (IN $ MILLION)
FIGURE 10: GLOBAL ACTIVATED CARBON MARKET, GROWTH POTENTIAL, BY RAW MATERIAL, IN 2022
FIGURE 11: GLOBAL ACTIVATED CARBON MARKET, BY COAL, 2023-2032 (IN $ MILLION)
FIGURE 12: GLOBAL ACTIVATED CARBON MARKET, BY COCONUT SHELL, 2023-2032 (IN $ MILLION)
FIGURE 13: GLOBAL ACTIVATED CARBON MARKET, BY WOOD, 2023-2032 (IN $ MILLION)
FIGURE 14: GLOBAL ACTIVATED CARBON MARKET, BY OTHER RAW MATERIALS, 2023-2032 (IN $ MILLION)
FIGURE 15: GLOBAL ACTIVATED CARBON MARKET, GROWTH POTENTIAL, BY END-USER, IN 2022
FIGURE 16: GLOBAL ACTIVATED CARBON MARKET, BY WATER TREATMENT, 2023-2032 (IN $ MILLION)
FIGURE 17: GLOBAL ACTIVATED CARBON MARKET, BY FOOD & BEVERAGE, 2023-2032 (IN $ MILLION)
FIGURE 18: GLOBAL ACTIVATED CARBON MARKET, BY PHARMACEUTICAL AND MEDICAL, 2023-2032 (IN $ MILLION)
FIGURE 19: GLOBAL ACTIVATED CARBON MARKET, BY AUTOMOTIVE, 2023-2032 (IN $ MILLION)
FIGURE 20: GLOBAL ACTIVATED CARBON MARKET, BY AIR PURIFICATION, 2023-2032 (IN $ MILLION)
FIGURE 21: GLOBAL ACTIVATED CARBON MARKET, BY OTHER END-USERS, 2023-2032 (IN $ MILLION)
FIGURE 22: NORTH AMERICA ACTIVATED CARBON MARKET, COUNTRY OUTLOOK, 2022 & 2032 (IN %)
FIGURE 23: UNITED STATES ACTIVATED CARBON MARKET, 2023-2032 (IN $ MILLION)
FIGURE 24: CANADA ACTIVATED CARBON MARKET, 2023-2032 (IN $ MILLION)
FIGURE 25: EUROPE ACTIVATED CARBON MARKET, COUNTRY OUTLOOK, 2022 & 2032 (IN %)
FIGURE 26: UNITED KINGDOM ACTIVATED CARBON MARKET, 2023-2032 (IN $ MILLION)
FIGURE 27: GERMANY ACTIVATED CARBON MARKET, 2023-2032 (IN $ MILLION)
FIGURE 28: FRANCE ACTIVATED CARBON MARKET, 2023-2032 (IN $ MILLION)
FIGURE 29: ITALY ACTIVATED CARBON MARKET, 2023-2032 (IN $ MILLION)
FIGURE 30: SPAIN ACTIVATED CARBON MARKET, 2023-2032 (IN $ MILLION)
FIGURE 31: REST OF EUROPE ACTIVATED CARBON MARKET, 2023-2032 (IN $ MILLION)
FIGURE 32: ASIA-PACIFIC ACTIVATED CARBON MARKET, COUNTRY OUTLOOK, 2022 & 2032 (IN %)
FIGURE 33: CHINA ACTIVATED CARBON MARKET, 2023-2032 (IN $ MILLION)
FIGURE 34: JAPAN ACTIVATED CARBON MARKET, 2023-2032 (IN $ MILLION)
FIGURE 35: INDIA ACTIVATED CARBON MARKET, 2023-2032 (IN $ MILLION)
FIGURE 36: SOUTH KOREA ACTIVATED CARBON MARKET, 2023-2032 (IN $ MILLION)
FIGURE 37: AUSTRALIA ACTIVATED CARBON MARKET, 2023-2032 (IN $ MILLION)
FIGURE 38: REST OF ASIA-PACIFIC ACTIVATED CARBON MARKET, 2023-2032 (IN $ MILLION)
FIGURE 39: REST OF WORLD ACTIVATED CARBON MARKET, REGIONAL OUTLOOK, 2022 & 2032 (IN %)
FIGURE 40: LATIN AMERICA ACTIVATED CARBON MARKET, 2023-2032 (IN $ MILLION)
FIGURE 41: MIDDLE EAST & AFRICA ACTIVATED CARBON MARKET, 2023-2032 (IN $ MILLION)
FAQ’s
FAQs
The global activated carbon market study covers product type, raw material, and end-user.
Asia-Pacific is set to hold the largest share of the global activated carbon market.
RELATED REPORTS
-
GLOBAL INDUSTRIAL FURNACE MARKET FORECAST 2024-2032
-
VIETNAM INDUSTRIAL FURNACE MARKET FORECAST 2024-2032
-
POLAND INDUSTRIAL FURNACE MARKET FORECAST 2024-2032
-
INDIA INDUSTRIAL FURNACE MARKET FORECAST 2024-2032
-
GLOBAL BULK METALLIC GLASS MARKET FORECAST 2024-2032
-
GLOBAL SILICON CARBIDE (SIC) FIBER MARKET FORECAST 2024-2032
-
UNITED STATES SILICON CARBIDE (SIC) FIBER MARKET FORECAST 2024-2032
-
GERMANY SILICON CARBIDE (SIC) FIBER MARKET FORECAST 2024-2032
-
CHINA SILICON CARBIDE (SIC) FIBER MARKET FORECAST 2024-2032
-
GLOBAL CHEMICAL DISTRIBUTION MARKET FORECAST 2024-2032