GLOBAL 3D PRINTING MARKET FORECAST 2023-2032
SCOPE OF THE REPORT
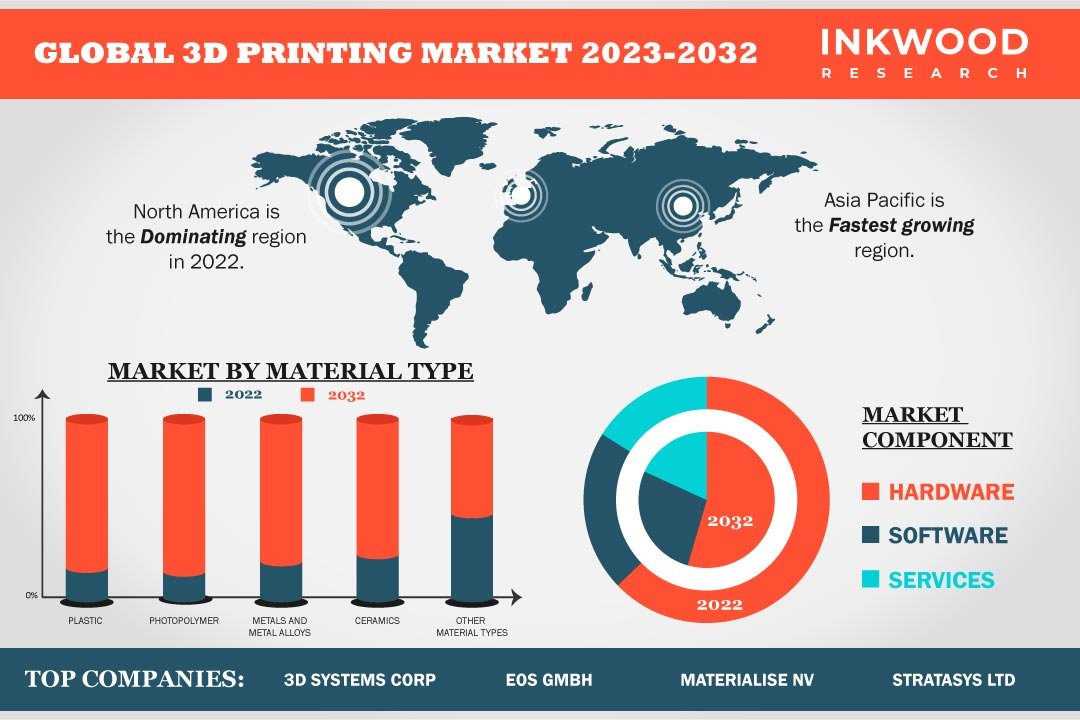
Global 3D Printing Market by Component (Hardware, Software, Services) Market by Technology (Stereolithography, Fuse Deposition Modeling, Selective Laser Sintering, Direct Metal Laser Sintering, Polyjet Printing, Inkjet Printing, Electron Beam Melting, Laser Metal Deposition, Digital Light Processing, Laminated Object Manufacturing) Market by Industry Vertical (Automotive, Aerospace & Defense, Healthcare, Consumer Electronics, Industrial Products, Power & Energy, Other Industry Verticals) Market by Application (Prototyping, Tooling, Low-volume Manufacturing, Healthcare & Biomedical Devices, Art & Design, Other Applications) Market by Material Type (Plastic, Photopolymer, Metals and Metal Alloys, Ceramics, Other Material Types) by Geography
REPORTS » INFORMATION TECHNOLOGY » ICT HARDWARE » GLOBAL 3D PRINTING MARKET FORECAST 2023-2032
MARKET OVERVIEW
The global 3D printing market is expected to reach $109258.46 million by 2032, growing at a CAGR of 18.41% during the forecast years. The base year considered for the studied market is 2022, and the estimated period is between 2023 and 2032. The market study has also analyzed the impact of COVID-19 on the global 3D printing market qualitatively as well as quantitatively.
3D printing, also referred to as additive manufacturing, is the process of fabricating three-dimensional objects by utilizing a digital file and building them layer by layer. It enables the construction of intricate and complex objects by employing a variety of materials, including plastics, metals, and ceramics. This technology has revolutionized the manufacturing industry by facilitating the production of complex shapes and geometries that were previously impossible to produce using traditional manufacturing methods.
3D printing is used in various industries such as aerospace, automotive, healthcare, architecture, fashion, and others. Moreover, the process can also be employed to create prototypes, functional parts, tools, artistic sculptures, medical implants, customized prosthetics, and even entire buildings.
Read our latest blog on the 3D Printing Market
GROWTH ENABLERS
Key enablers of the global 3D printing market growth:
- Growing use of 3D printing for enhanced manufacturing efficiency
- The adoption of 3D printers has increased among manufacturers, given their accuracy in printing objects. Integrating 3D printing during the initial stages of production proves advantageous as it allows designers to identify errors and defects in the structure, thereby reducing production time and operational costs.
- Also, this technology enables the incorporation of intricate designs and the optimization of operational resources. Furthermore, 3D printing also supplements material usage and minimizes wastage in comparison to subtractive techniques.
- Traditional manufacturing methods often result in significant material loss throughout the production process; in contrast, 3D printing involves the precise deposition of materials layer by layer. As the 3D printing market continues to evolve, it is expected to witness dynamic growth, revolutionizing the way objects are created and manufactured.
- Substantially beneficial over traditional methods
- Utilization of multiple materials for printing
- Minimizing human errors
- 3D printing facilitates customization and innovation
- Reduced costs and time
- Rising use of 3D printing technology in various industries
GROWTH RESTRAINTS
Key growth restraining factors of the global 3D printing market:
- Shortage of skilled labor
- The operation of a 3D printer necessitates specialized knowledge and technical expertise, unlike conventional manufacturing methods that can be performed by unskilled labor. Skilled personnel are required to effectively operate and manage a 3D printing system, which involves a certain level of training and proficiency. This requirement for qualified personnel adds to the cost of 3D printing, as higher investments are needed to acquire and train individuals. As a result, the overall expense of implementing 3D printing technology increases.
- It is crucial to acknowledge that 3D printing extends beyond a singular technique; it encompasses a comprehensive ecosystem entailing a wide range of technologies, methodologies, components, tools, and industry-specific applications. However, the absence of skilled operators, technicians, or knowledgeable employees in the field of 3D printing can hinder the market’s growth.
- Implementation costs for individual consumers
- Legal risks and regulation standards
- Weak structural design
To Know More About This Report, Request a Free Sample Copy
KEY MARKET TRENDS
Global 3D Printing Market | Top Market Trends
- The applications of 3D printing are expanding across various industries, including medical, dental, aerospace, and food. The versatility of 3D printing technology in this regard enables its use in diverse fields, driving the demand for its adoption as well as further growth.
- With the increasing adoption of 3D printing by businesses, there is a rising demand for 3D printing services. These include prototyping, design, and production, allowing businesses to leverage the benefits of 3D printing without the need for extensive equipment investments.
- 3D printing is also being integrated with cutting-edge technologies like artificial intelligence (AI), robotics, and virtual reality to unlock new realms of possibilities in design, production, and customization. This integration allows for enhanced automation, precision, and efficiency in the 3D printing process.
MARKET SEGMENTATION
Market Segmentation – Component, Material Type, Technology, Application, and Industry Vertical –
Market by Component:
- Hardware
- Software
- Software is anticipated to be the fastest-growing component in the market, with a CAGR of 21.45%.
- The software segment comprises computer-aided design (CAD) software, slicing software, and others utilized in the 3D printing process.
- Some of the leading 3D printing software include AutoCAD, Solidworks, Ultimaker Cura, Creo, Materialise Magics, and TinkerCAD. Moreover, major software companies operating in the software segment include Autodesk Inc and Materialise NV, among others.
- The software segment is witnessing significant growth owing to the increasing adoption of 3D printing technology across various industries, including automotive, aerospace, and healthcare. Moreover, the development of user-friendly software and the integration of artificial intelligence (AI) and machine learning (ML) technologies further drive the segment’s growth.
- Services
Market by Material Type:
- Plastic
- In 2022, the majority of the market share was captured by the plastic segment under the material type category.
- Plastics are the most commonly employed materials for 3D printing. Due to the development of consumer 3D printers that utilize plastic and photopolymer filaments to print objects that are specifically used in the consumer and fashion & aesthetics industry, the demand for these materials has increased significantly, and is expected to grow more in the forecasted period.
- A wide variety of plastics have been developed for 3D printing. Acrylonitrile butadiene styrene (ABS), polylactic acid (PLA), polycarbonate (PC) and polyvinyl alcohol (PVA) are the most widely employed plastic 3D printing materials, generally utilized for printing objects with curved edges and complex shapes. For most, these materials are ideal as they take lesser time to print.
- Photopolymer
- Metals and Metal Alloys
- Ceramics
- Other Material Types
Market by Application:
- Prototyping
- Tooling
- Low-Volume Manufacturing
- Healthcare & Biomedical Devices
- Art & Design
- Other Applications
Market by Technology:
- Laminated Object Manufacturing (LOM)
- Stereolithography
- Fuse Deposition Modelling (FDM)
- Selective Laser Sintering (SLS)
- Electron Beam Melting (EBM)
- Direct Metal Laser Sintering (DMLS)
- Inkjet Printing
- Laser Metal Deposition (LMD)
- Polyjet Printing
- Digital Light Processing (DLP)
Market by Industry Vertical:
- Automotive
- Aerospace & Defense
- Healthcare
- Consumer Electronics
- Industrial Products
- Power & Energy
- Other Industry Verticals
GEOGRAPHICAL STUDY
Geographical Study Based on Four Major Regions:- North America: The United States and Canada
- North America is anticipated to be the largest regional market, with a share of 36.95% in 2022.
- The North America 3D printing market has witnessed considerable growth, owing to technological advancements and their applications in the 3D printing and development process.
- North America is at the forefront of the development of 3D printing. The regional market thrives on the ongoing surge in industrial automation. Further, the region is also witnessing significant growth across industries such as manufacturing, chemicals, and energy.
- Europe: The United Kingdom, Germany, France, Italy, Spain, Belgium, Poland, and Rest of Europe
- Asia-Pacific: China, Japan, India, South Korea, Indonesia, Thailand, Vietnam, Philippines, Taiwan, Hong Kong, Malaysia, Singapore, Australia & New Zealand, and Rest of Asia-Pacific
- Rest of World: Latin America, the Middle East & Africa
MAJOR PLAYERS
Key players in the global 3D printing market:
- Stratasys Ltd
- 3D Systems Corporation
- EOS GmbH
- HP Inc
- Materialise NV
- GE Additive
Key strategies adopted by some of these companies:
- In August 2022, Covestro reached a definitive agreement to sell its additive manufacturing business to Stratasys.
- In February 2023, 3D Systems Corporation unveiled the ProJet MJP 2500W Plus, a new 3D printing solution designed specifically for jewelry manufacturing. This innovative technology significantly enhances productivity by achieving up to 25% higher throughput of 100% wax casting patterns.
REPORT SYNOPSIS
| REPORT SCOPE | DETAILS |
|---|---|
| Market Forecast Years | 2023-2032 |
| Base Year | 2022 |
| Market Historical Years | 2018-2022 |
| Forecast Units | Revenue ($ Million) |
| Segments Analyzed | Component, Material Type, Technology, Application, and Industry Vertical |
| Geographies Analyzed | North America, Europe, Asia-Pacific, and Rest of World |
| Companies Analyzed | 3D Systems Inc, Arkema SA, Autodesk Inc, BASF SE (BASF 3D Printing Solutions GmbH), Covestro AG, EOS GmbH Electro Optical Systems (EOS), Evonik Industries AG, ExOne (Desktop Metal Inc), Formlabs, GE Additive, Höganäs AB, HP Inc, Markforged, Materialise NV, Optomec Inc, Organovo Holdings Inc, Renishaw PLC, SLM Solutions, Stratasys Ltd, voxeljet AG |
TABLE OF CONTENT
RESEARCH SCOPE & METHODOLOGY
- STUDY OBJECTIVES
- SCOPE OF STUDY
- METHODOLOGY
- ASSUMPTIONS & LIMITATIONS
EXECUTIVE SUMMARY
- MARKET SIZE & ESTIMATES
- MARKET OVERVIEW
MARKET DYNAMICS
- MARKET DEFINITION
- KEY DRIVERS
- GROWING USE OF 3D PRINTING FOR ENHANCED MANUFACTURING EFFICIENCY
- SUBSTANTIAL BENEFITS OVER TRADITIONAL METHODS
- UTILIZATION OF MULTIPLE MATERIALS FOR PRINTING
- MINIMIZING HUMAN ERRORS
- 3D PRINTING FACILITATES CUSTOMIZATION AND INNOVATION
- 3D PRINTING SAVES COST AND TIME
- RISING USE OF 3D PRINTING TECHNOLOGY IN VARIOUS INDUSTRIES
- KEY RESTRAINTS
- SHORTAGE OF SKILLED LABOR
- IMPLEMENTATION COSTS FOR INDIVIDUAL CONSUMERS
- LEGAL RISKS AND REGULATION STANDARDS
- WEAK STRUCTURAL DESIGN
KEY ANALYTICS
- IMPACT OF COVID-19 ON 3D PRINTING MARKET
- KEY MARKET TRENDS
- PORTER’S FIVE FORCES ANALYSIS
- BUYERS POWER
- SUPPLIERS POWER
- SUBSTITUTION
- NEW ENTRANTS
- INDUSTRY RIVALRY
- OPPORTUNITY MATRIX
- SUPPLY CHAIN ANALYSIS
- SECTOR-WISE ADOPTION OF 3D PRINTING
- REGULATORY FRAMEWORK
- MARKET SHARE ANALYSIS OF TOP PLAYERS IN THE 3D PRINTING MARKET
MARKET BY COMPONENT
- HARDWARE
- SOFTWARE
- SERVICES
MARKET BY TECHNOLOGY
- STEREOLITHOGRAPHY
- FUSE DEPOSITION MODELING (FDM)
- SELECTIVE LASER SINTERING (SLS)
- DIRECT METAL LASER SINTERING (DMLS)
- POLYJET PRINTING
- INKJET PRINTING
- ELECTRON BEAM MELTING (EBM)
- LASER METAL DEPOSITION (LMD)
- DIGITAL LIGHT PROCESSING (DLP)
- LAMINATED OBJECT MANUFACTURING (LOM)
MARKET BY INDUSTRY VERTICAL
- AUTOMOTIVE
- AEROSPACE & DEFENSE
- HEALTHCARE
- CONSUMER ELECTRONICS
- INDUSTRIAL PRODUCTS
- POWER & ENERGY
- OTHER INDUSTRY VERTICALS
MARKET BY APPLICATION
- PROTOTYPING
- TOOLING
- LOW-VOLUME MANUFACTURING
- HEALTHCARE & BIOMEDICAL DEVICES
- ART & DESIGN
- OTHER APPLICATIONS
MARKET BY MATERIAL TYPE
- PLASTIC
- PHOTOPOLYMER
- METALS AND METAL ALLOYS
- CERAMICS
- OTHER MATERIAL TYPES
GEOGRAPHICAL ANALYSIS
- NORTH AMERICA
- MARKET SIZE & ESTIMATES
- KEY GROWTH ENABLERS
- KEY CHALLENGES
- KEY PLAYERS
- COUNTRY ANALYSIS
- UNITED STATES
- CANADA
- EUROPE
- MARKET SIZE & ESTIMATES
- KEY GROWTH ENABLERS
- KEY CHALLENGES
- KEY PLAYERS
- COUNTRY ANALYSIS
- UNITED KINGDOM
- GERMANY
- FRANCE
- ITALY
- SPAIN
- BELGIUM
- POLAND
- REST OF EUROPE
- ASIA-PACIFIC
- MARKET SIZE & ESTIMATES
- KEY GROWTH ENABLERS
- KEY CHALLENGES
- KEY PLAYERS
- COUNTRY ANALYSIS
- CHINA
- JAPAN
- INDIA
- SOUTH KOREA
- INDONESIA
- THAILAND
- VIETNAM
- PHILIPPINES
- TAIWAN
- HONG KONG
- MALAYSIA
- SINGAPORE
- AUSTRALIA & NEW ZEALAND
- REST OF ASIA-PACIFIC
- REST OF WORLD
- MARKET SIZE & ESTIMATES
- KEY GROWTH ENABLERS
- KEY CHALLENGES
- KEY PLAYERS
- REGIONAL ANALYSIS
- LATIN AMERICA
- MIDDLE EAST & AFRICA
- NORTH AMERICA
COMPETITIVE LANDSCAPE
- KEY STRATEGIC DEVELOPMENTS
- MERGERS & ACQUISITIONS
- PRODUCT LAUNCHES & DEVELOPMENTS
- PARTNERSHIPS & AGREEMENTS
- BUSINESS EXPANSIONS & DIVESTITURES
- COMPANY PROFILES
- 3D SYSTEMS INC
- ARKEMA SA
- AUTODESK INC
- BASF SE (BASF 3D PRINTING SOLUTIONS GMBH)
- COVESTRO AG
- EOS GMBH ELECTRO OPTICAL SYSTEMS (EOS)
- EVONIK INDUSTRIES AG
- EXONE (DESKTOP METAL INC)
- FORMLABS
- GE ADDITIVE
- HÖGANÄS AB
- HP INC
- MARKFORGED
- MATERIALISE NV
- OPTOMEC INC
- ORGANOVO HOLDINGS INC
- RENISHAW PLC
- SLM SOLUTIONS
- STRATASYS LTD
- VOXELJET AG
- KEY STRATEGIC DEVELOPMENTS
LIST OF TABLES
TABLE 1: MARKET SNAPSHOT – GLOBAL 3D PRINTING MARKET
TABLE 2: TYPES OF MATERIALS USED IN 3D PRINTING
TABLE 3: REGULATORY FRAMEWORK
TABLE 4: GLOBAL 3D PRINTING MARKET, BY COMPONENT, HISTORICAL YEARS, 2018-2022 (IN $ MILLION)
TABLE 5: GLOBAL 3D PRINTING MARKET, BY COMPONENT, FORECAST YEARS, 2023-2032 (IN $ MILLION)
TABLE 6: GLOBAL HARDWARE MARKET, BY REGION, HISTORICAL YEARS, 2018-2022 (IN $ MILLION)
TABLE 7: GLOBAL HARDWARE MARKET, BY REGION, FORECAST YEARS, 2023-2032 (IN $ MILLION)
TABLE 8: GLOBAL SOFTWARE MARKET, BY REGION, HISTORICAL YEARS, 2018-2022 (IN $ MILLION)
TABLE 9: GLOBAL SOFTWARE MARKET, BY REGION, FORECAST YEARS, 2023-2032 (IN $ MILLION)
TABLE 10: GLOBAL SERVICES MARKET, BY REGION, HISTORICAL YEARS, 2018-2022 (IN $ MILLION)
TABLE 11: GLOBAL SERVICES MARKET, BY REGION, FORECAST YEARS, 2023-2032 (IN $ MILLION)
TABLE 12: GLOBAL 3D PRINTING MARKET, BY TECHNOLOGY, HISTORICAL YEARS, 2018-2022 (IN $ MILLION)
TABLE 13: GLOBAL 3D PRINTING MARKET, BY TECHNOLOGY, FORECAST YEARS, 2023-2032 (IN $ MILLION)
TABLE 14: GLOBAL STEREOLITHOGRAPHY MARKET, BY REGION, HISTORICAL YEARS, 2018-2022 (IN $ MILLION)
TABLE 15: GLOBAL STEREOLITHOGRAPHY MARKET, BY REGION, FORECAST YEARS, 2023-2032 (IN $ MILLION)
TABLE 16: GLOBAL FUSE DEPOSITION MODELING (FDM) MARKET, BY REGION, HISTORICAL YEARS, 2018-2022 (IN $ MILLION)
TABLE 17: GLOBAL FUSE DEPOSITION MODELING (FDM) MARKET, BY REGION, FORECAST YEARS, 2023-2032 (IN $ MILLION)
TABLE 18: GLOBAL SELECTIVE LASER SINTERING (SLS) MARKET, BY REGION, HISTORICAL YEARS, 2018-2022 (IN $ MILLION)
TABLE 19: GLOBAL SELECTIVE LASER SINTERING (SLS) MARKET, BY REGION, FORECAST YEARS, 2023-2032 (IN $ MILLION)
TABLE 20: GLOBAL DIRECT METAL LASER SINTERING (DMLS) MARKET, BY REGION, HISTORICAL YEARS, 2018-2022 (IN $ MILLION)
TABLE 21: GLOBAL DIRECT METAL LASER SINTERING (DMLS) MARKET, BY REGION, FORECAST YEARS, 2023-2032 (IN $ MILLION)
TABLE 22: GLOBAL POLYJET PRINTING MARKET, BY REGION, HISTORICAL YEARS, 2018-2022 (IN $ MILLION)
TABLE 23: GLOBAL POLYJET PRINTING MARKET, BY REGION, FORECAST YEARS, 2023-2032 (IN $ MILLION)
TABLE 24: GLOBAL INKJET PRINTING MARKET, BY REGION, HISTORICAL YEARS, 2018-2022 (IN $ MILLION)
TABLE 25: GLOBAL INKJET PRINTING MARKET, BY REGION, FORECAST YEARS, 2023-2032 (IN $ MILLION)
TABLE 26: GLOBAL ELECTRON BEAM MELTING (EBM) MARKET, BY REGION, HISTORICAL YEARS, 2018-2022 (IN $ MILLION)
TABLE 27: GLOBAL ELECTRON BEAM MELTING (EBM) MARKET, BY REGION, FORECAST YEARS, 2023-2032 (IN $ MILLION)
TABLE 28: GLOBAL LASER METAL DEPOSITION (LMD) MARKET, BY REGION, HISTORICAL YEARS, 2018-2022 (IN $ MILLION)
TABLE 29: GLOBAL LASER METAL DEPOSITION (LMD) MARKET, BY REGION, FORECAST YEARS, 2023-2032 (IN $ MILLION)
TABLE 30: GLOBAL DIGITAL LIGHT PROCESSING (DLP) MARKET, BY REGION, HISTORICAL YEARS, 2018-2022 (IN $ MILLION)
TABLE 31: GLOBAL DIGITAL LIGHT PROCESSING (DLP) MARKET, BY REGION, FORECAST YEARS, 2023-2032 (IN $ MILLION)
TABLE 32: GLOBAL LAMINATED OBJECT MANUFACTURING (LOM) MARKET, BY REGION, HISTORICAL YEARS, 2018-2022 (IN $ MILLION)
TABLE 33: GLOBAL LAMINATED OBJECT MANUFACTURING (LOM) MARKET, BY REGION, FORECAST YEARS, 2023-2032 (IN $ MILLION)
TABLE 34: GLOBAL 3D PRINTING MARKET, BY INDUSTRY VERTICAL, HISTORICAL YEARS, 2018-2022 (IN $ MILLION)
TABLE 35: GLOBAL 3D PRINTING MARKET, BY INDUSTRY VERTICAL, FORECAST YEARS, 2023-2032 (IN $ MILLION)
TABLE 36: GLOBAL AUTOMOTIVE MARKET, BY REGION, HISTORICAL YEARS, 2018-2022 (IN $ MILLION)
TABLE 37: GLOBAL AUTOMOTIVE MARKET, BY REGION, FORECAST YEARS, 2023-2032 (IN $ MILLION)
TABLE 38: GLOBAL AEROSPACE & DEFENSE MARKET, BY REGION, HISTORICAL YEARS, 2018-2022 (IN $ MILLION)
TABLE 39: GLOBAL AEROSPACE & DEFENSE MARKET, BY REGION, FORECAST YEARS, 2023-2032 (IN $ MILLION)
TABLE 40: GLOBAL HEALTHCARE MARKET, BY REGION, HISTORICAL YEARS, 2018-2022 (IN $ MILLION)
TABLE 41: GLOBAL HEALTHCARE MARKET, BY REGION, FORECAST YEARS, 2023-2032 (IN $ MILLION)
TABLE 42: GLOBAL CONSUMER ELECTRONICS MARKET, BY REGION, HISTORICAL YEARS, 2018-2022 (IN $ MILLION)
TABLE 43: GLOBAL CONSUMER ELECTRONICS MARKET, BY REGION, FORECAST YEARS, 2023-2032 (IN $ MILLION)
TABLE 44: GLOBAL INDUSTRIAL PRODUCTS MARKET, BY REGION, HISTORICAL YEARS, 2018-2022 (IN $ MILLION)
TABLE 45: GLOBAL INDUSTRIAL PRODUCTS MARKET, BY REGION, FORECAST YEARS, 2023-2032 (IN $ MILLION)
TABLE 46: GLOBAL POWER & ENERGY MARKET, BY REGION, HISTORICAL YEARS, 2018-2022 (IN $ MILLION)
TABLE 47: GLOBAL POWER & ENERGY MARKET, BY REGION, FORECAST YEARS, 2023-2032 (IN $ MILLION)
TABLE 48: GLOBAL OTHER INDUSTRY VERTICALS MARKET, BY REGION, HISTORICAL YEARS, 2018-2022 (IN $ MILLION)
TABLE 49: GLOBAL OTHER INDUSTRY VERTICALS MARKET, BY REGION, FORECAST YEARS, 2023-2032 (IN $ MILLION)
TABLE 50: GLOBAL 3D PRINTING MARKET, BY APPLICATION, HISTORICAL YEARS, 2018-2022 (IN $ MILLION)
TABLE 51: GLOBAL 3D PRINTING MARKET, BY APPLICATION, FORECAST YEARS, 2023-2032 (IN $ MILLION)
TABLE 52: GLOBAL PROTOTYPING MARKET, BY REGION, HISTORICAL YEARS, 2018-2022 (IN $ MILLION)
TABLE 53: GLOBAL PROTOTYPING MARKET, BY REGION, FORECAST YEARS, 2023-2032 (IN $ MILLION)
TABLE 54: GLOBAL TOOLING MARKET, BY REGION, HISTORICAL YEARS, 2018-2022 (IN $ MILLION)
TABLE 55: GLOBAL TOOLING MARKET, BY REGION, FORECAST YEARS, 2023-2032 (IN $ MILLION)
TABLE 56: GLOBAL LOW-VOLUME MANUFACTURING MARKET, BY REGION, HISTORICAL YEARS, 2018-2022 (IN $ MILLION)
TABLE 57: GLOBAL LOW-VOLUME MANUFACTURING MARKET, BY REGION, FORECAST YEARS, 2023-2032 (IN $ MILLION)
TABLE 58: GLOBAL HEALTHCARE & BIOMEDICAL DEVICES MARKET, BY REGION, HISTORICAL YEARS, 2018-2022 (IN $ MILLION)
TABLE 59: GLOBAL HEALTHCARE & BIOMEDICAL DEVICES MARKET, BY REGION, FORECAST YEARS, 2023-2032 (IN $ MILLION)
TABLE 60: GLOBAL ART & DESIGN MARKET, BY REGION, HISTORICAL YEARS, 2018-2022 (IN $ MILLION)
TABLE 61: GLOBAL ART & DESIGN MARKET, BY REGION, FORECAST YEARS, 2023-2032 (IN $ MILLION)
TABLE 62: GLOBAL OTHER APPLICATIONS MARKET, BY REGION, HISTORICAL YEARS 2018-2022 (IN $ MILLION)
TABLE 63: GLOBAL OTHER APPLICATIONS MARKET, BY REGION, FORECAST YEARS 2023-2032 (IN $ MILLION)
TABLE 64: GLOBAL 3D PRINTING MARKET, BY MATERIAL TYPE, HISTORICAL YEARS, 2018-2022 (IN $ MILLION)
TABLE 65: GLOBAL 3D PRINTING MARKET, BY MATERIAL TYPE, FORECAST YEARS, 2023-2032 (IN $ MILLION)
TABLE 66: GLOBAL PLASTIC MARKET, BY REGION, HISTORICAL YEARS, 2018-2022 (IN $ MILLION)
TABLE 67: GLOBAL PLASTIC MARKET, BY REGION, FORECAST YEARS, 2023-2032 (IN $ MILLION)
TABLE 68: GLOBAL PHOTOPOLYMER MARKET, BY REGION, HISTORICAL YEARS, 2018-2022 (IN $ MILLION)
TABLE 69: GLOBAL PHOTOPOLYMER MARKET, BY REGION, FORECAST YEARS, 2023-2032 (IN $ MILLION)
TABLE 70: GLOBAL METALS AND METAL ALLOYS MARKET, BY REGION, HISTORICAL YEARS, 2018-2022 (IN $ MILLION)
TABLE 71: GLOBAL METALS AND METAL ALLOYS MARKET, BY REGION, FORECAST YEARS, 2023-2032 (IN $ MILLION)
TABLE 72: GLOBAL CERAMICS MARKET, BY REGION, HISTORICAL YEARS, 2018-2022 (IN $ MILLION)
TABLE 73: GLOBAL CERAMICS MARKET, BY REGION, FORECAST YEARS, 2023-2032 (IN $ MILLION)
TABLE 74: GLOBAL OTHER MATERIAL TYPES MARKET, BY REGION, HISTORICAL YEARS, 2018-2022 (IN $ MILLION)
TABLE 75: GLOBAL OTHER MATERIAL TYPES MARKET, BY REGION, FORECAST YEARS, 2023-2032 (IN $ MILLION)
TABLE 76: GLOBAL 3D PRINTING MARKET, BY GEOGRAPHY, HISTORICAL YEARS, 2018-2022 (IN $ MILLION)
TABLE 77: GLOBAL 3D PRINTING MARKET, BY GEOGRAPHY, FORECAST YEARS, 2023-2032 (IN $ MILLION)
TABLE 78: NORTH AMERICA 3D PRINTING MARKET, BY COUNTRY, HISTORICAL YEARS, 2018-2022 (IN $ MILLION)
TABLE 79: NORTH AMERICA 3D PRINTING MARKET, BY COUNTRY, FORECAST YEARS, 2023-2032 (IN $ MILLION)
TABLE 80: LEADING PLAYERS OPERATING IN NORTH AMERICA 3D PRINTING MARKET
TABLE 81: EUROPE 3D PRINTING MARKET, BY COUNTRY, HISTORICAL YEARS, 2018-2022 (IN $ MILLION)
TABLE 82: EUROPE 3D PRINTING MARKET, BY COUNTRY, FORECAST YEARS, 2023-2032 (IN $ MILLION)
TABLE 83: LEADING PLAYERS OPERATING IN EUROPE 3D PRINTING MARKET
TABLE 84: ASIA-PACIFIC 3D PRINTING MARKET, BY COUNTRY, HISTORICAL YEARS, 2018-2022 (IN $ MILLION)
TABLE 85: ASIA-PACIFIC 3D PRINTING MARKET, BY COUNTRY, FORECAST YEARS, 2023-2032 (IN $ MILLION)
TABLE 86: LEADING PLAYERS OPERATING IN ASIA-PACIFIC 3D PRINTING MARKET
TABLE 87: REST OF WORLD 3D PRINTING MARKET, BY REGION, HISTORICAL YEARS, 2018-2022 (IN $ MILLION)
TABLE 88: REST OF WORLD 3D PRINTING MARKET, BY REGION, FORECAST YEARS, 2023-2032 (IN $ MILLION)
TABLE 89: LEADING PLAYERS OPERATING IN REST OF WORLD 3D PRINTING MARKET
TABLE 90: LIST OF MERGERS & ACQUISITIONS
TABLE 91: LIST OF PRODUCT LAUNCHES & DEVELOPMENTS
TABLE 92: LIST OF PARTNERSHIPS & AGREEMENTS
TABLE 93: LIST OF BUSINESS EXPANSIONS & DIVESTITURES
LIST OF FIGURES
FIGURE 1: KEY MARKET TRENDS
FIGURE 2: PORTER’S FIVE FORCES ANALYSIS
FIGURE 3: OPPORTUNITY MATRIX
FIGURE 4: GLOBAL 3D PRINTING MARKET, GROWTH POTENTIAL, BY COMPONENT, IN 2022
FIGURE 5: GLOBAL 3D PRINTING MARKET, BY HARDWARE, 2023-2032 (IN $ MILLION)
FIGURE 6: GLOBAL 3D PRINTING MARKET, BY SOFTWARE, 2023-2032 (IN $ MILLION)
FIGURE 7: GLOBAL 3D PRINTING MARKET, BY SERVICES, 2023-2032 (IN $ MILLION)
FIGURE 8: GLOBAL 3D PRINTING MARKET, GROWTH POTENTIAL, BY TECHNOLOGY, IN 2022
FIGURE 9: GLOBAL 3D PRINTING MARKET, BY STEREOLITHOGRAPHY, 2023-2032 (IN $ MILLION)
FIGURE 10: GLOBAL 3D PRINTING MARKET, BY FUSE DEPOSITION MODELING (FDM), 2023-2032 (IN $ MILLION)
FIGURE 11: GLOBAL 3D PRINTING MARKET, BY SELECTIVE LASER SINTERING (SLS), 2023-2032 (IN $ MILLION)
FIGURE 12: GLOBAL 3D PRINTING MARKET, BY DIRECT METAL LASER SINTERING (DMLS), 2023-2032 (IN $ MILLION)
FIGURE 13: GLOBAL 3D PRINTING MARKET, BY POLYJET PRINTING, 2023-2032 (IN $ MILLION)
FIGURE 14: GLOBAL 3D PRINTING MARKET, BY INKJET PRINTING, 2023-2032 (IN $ MILLION)
FIGURE 15: GLOBAL 3D PRINTING MARKET, BY ELECTRON BEAM MELTING (EBM), 2023-2032 (IN $ MILLION)
FIGURE 16: GLOBAL 3D PRINTING MARKET, BY LASER METAL DEPOSITION (LMD), 2023-2032 (IN $ MILLION)
FIGURE 17: GLOBAL 3D PRINTING MARKET, BY DIGITAL LIGHT PROCESSING (DLP), 2023-2032 (IN $ MILLION)
FIGURE 18: GLOBAL 3D PRINTING MARKET, BY LAMINATED OBJECT MANUFACTURING (LOM), 2023-2032 (IN $ MILLION)
FIGURE 19: GLOBAL 3D PRINTING MARKET, GROWTH POTENTIAL, BY INDUSTRY VERTICAL, IN 2022
FIGURE 20: GLOBAL 3D PRINTING MARKET, BY AUTOMOTIVE, 2023-2032 (IN $ MILLION)
FIGURE 21: GLOBAL 3D PRINTING MARKET, BY AEROSPACE & DEFENSE, 2023-2032 (IN $ MILLION)
FIGURE 22: GLOBAL 3D PRINTING MARKET, BY HEALTHCARE, 2023-2032 (IN $ MILLION)
FIGURE 23: GLOBAL 3D PRINTING MARKET, BY CONSUMER ELECTRONICS, 2023-2032 (IN $ MILLION)
FIGURE 24: GLOBAL 3D PRINTING MARKET, BY INDUSTRIAL PRODUCTS, 2023-2032 (IN $ MILLION)
FIGURE 25: GLOBAL 3D PRINTING MARKET, BY POWER & ENERGY, 2023-2032 (IN $ MILLION)
FIGURE 26: GLOBAL 3D PRINTING MARKET, BY OTHER INDUSTRY VERTICALS, 2023-2032 (IN $ MILLION)
FIGURE 27: GLOBAL 3D PRINTING MARKET, GROWTH POTENTIAL, BY APPLICATION, IN 2022
FIGURE 28: GLOBAL 3D PRINTING MARKET, BY PROTOTYPING, 2023-2032 (IN $ MILLION)
FIGURE 29: GLOBAL 3D PRINTING MARKET, BY TOOLING, 2023-2032 (IN $ MILLION)
FIGURE 30: GLOBAL 3D PRINTING MARKET, BY LOW-VOLUME MANUFACTURING, 2023-2032 (IN $ MILLION)
FIGURE 31: GLOBAL 3D PRINTING MARKET, BY HEALTHCARE & BIOMEDICAL DEVICES, 2023-2032 (IN $ MILLION)
FIGURE 32: GLOBAL 3D PRINTING MARKET, BY ART & DESIGN, 2023-2032 (IN $ MILLION)
FIGURE 33: GLOBAL 3D PRINTING MARKET, BY OTHER APPLICATIONS, 2023-2032 (IN $ MILLION)
FIGURE 34: GLOBAL 3D PRINTING MARKET, GROWTH POTENTIAL, BY MATERIAL TYPE, IN 2022
FIGURE 35: GLOBAL 3D PRINTING MARKET, BY PLASTIC, 2023-2032 (IN $ MILLION)
FIGURE 36: GLOBAL 3D PRINTING MARKET, BY PHOTOPOLYMER, 2023-2032 (IN $ MILLION)
FIGURE 37: GLOBAL 3D PRINTING MARKET, BY METALS AND METAL ALLOYS, 2023-2032 (IN $ MILLION)
FIGURE 38: GLOBAL 3D PRINTING MARKET, BY CERAMICS, 2023-2032 (IN $ MILLION)
FIGURE 39: GLOBAL 3D PRINTING MARKET, BY OTHER MATERIAL TYPES, 2023-2032 (IN $ MILLION)
FIGURE 40: NORTH AMERICA 3D PRINTING MARKET, COUNTRY OUTLOOK, 2022 & 2032 (IN %)
FIGURE 41: UNITED STATES 3D PRINTING MARKET, 2023-2032 (IN $ MILLION)
FIGURE 42: CANADA 3D PRINTING MARKET, 2023-2032 (IN $ MILLION)
FIGURE 43: EUROPE 3D PRINTING MARKET, COUNTRY OUTLOOK, 2022 & 2032 (IN %)
FIGURE 44: UNITED KINGDOM 3D PRINTING MARKET, 2023-2032 (IN $ MILLION)
FIGURE 45: GERMANY 3D PRINTING MARKET, 2023-2032 (IN $ MILLION)
FIGURE 46: FRANCE 3D PRINTING MARKET, 2023-2032 (IN $ MILLION)
FIGURE 47: ITALY 3D PRINTING MARKET, 2023-2032 (IN $ MILLION)
FIGURE 48: SPAIN 3D PRINTING MARKET, 2023-2032 (IN $ MILLION)
FIGURE 49: BELGIUM 3D PRINTING MARKET, 2023-2032 (IN $ MILLION)
FIGURE 50: POLAND 3D PRINTING MARKET, 2023-2032 (IN $ MILLION)
FIGURE 51: REST OF EUROPE 3D PRINTING MARKET, 2023-2032 (IN $ MILLION)
FIGURE 52: ASIA-PACIFIC 3D PRINTING MARKET, COUNTRY OUTLOOK, 2022 & 2032 (IN %)
FIGURE 53: CHINA 3D PRINTING MARKET, 2023-2032 (IN $ MILLION)
FIGURE 54: JAPAN 3D PRINTING MARKET, 2023-2032 (IN $ MILLION)
FIGURE 55: INDIA 3D PRINTING MARKET, 2023-2032 (IN $ MILLION)
FIGURE 56: SOUTH KOREA 3D PRINTING MARKET, 2023-2032 (IN $ MILLION)
FIGURE 57: INDONESIA 3D PRINTING MARKET, 2023-2032 (IN $ MILLION)
FIGURE 58: THAILAND 3D PRINTING MARKET, 2023-2032 (IN $ MILLION)
FIGURE 59: VIETNAM 3D PRINTING MARKET, 2023-2032 (IN $ MILLION)
FIGURE 60: PHILIPPINES 3D PRINTING MARKET, 2023-2032 (IN $ MILLION)
FIGURE 61: TAIWAN 3D PRINTING MARKET, 2023-2032 (IN $ MILLION)
FIGURE 62: HONG KONG 3D PRINTING MARKET, 2023-2032 (IN $ MILLION)
FIGURE 63: MALAYSIA 3D PRINTING MARKET, 2023-2032 (IN $ MILLION)
FIGURE 64: SINGAPORE 3D PRINTING MARKET, 2023-2032 (IN $ MILLION)
FIGURE 65: AUSTRALIA & NEW ZEALAND 3D PRINTING MARKET, 2023-2032 (IN $ MILLION)
FIGURE 66: REST OF ASIA-PACIFIC 3D PRINTING MARKET, 2023-2032 (IN $ MILLION)
FIGURE 67: REST OF WORLD 3D PRINTING MARKET, REGIONAL OUTLOOK, 2022 & 2032 (IN %)
FIGURE 68: LATIN AMERICA 3D PRINTING MARKET, 2023-2032 (IN $ MILLION)
FIGURE 69: MIDDLE EAST & AFRICA 3D PRINTING MARKET, 2023-2032 (IN $ MILLION)
FAQ’s
FAQs
As of 2022, the global 3D printing market was valued at $19042.54 million.
Healthcare & biomedical devices is the fastest-growing application in the global 3D printing market.
RELATED REPORTS
-
GLOBAL CONSUMER VIDEO FEEDBACK SOFTWARE MARKET FORECAST 2024-2032
-
GLOBAL AI TRAINING DATASET MARKET FORECAST 2024-2032
-
GLOBAL PRODUCTIVITY MANAGEMENT SOFTWARE MARKET FORECAST 2024-2032
-
CHINA PRODUCTIVITY MANAGEMENT SOFTWARE MARKET FORECAST 2024-2032
-
UNITED KINGDOM PRODUCTIVITY MANAGEMENT SOFTWARE MARKET FORECAST 2024-2032
-
UNITED STATES PRODUCTIVITY MANAGEMENT SOFTWARE MARKET FORECAST 2024-2032
-
GLOBAL SPORTS ANALYTICS MARKET FORECAST 2024-2032
-
ASIA-PACIFIC SPORTS ANALYTICS MARKET FORECAST 2024-2032
-
EUROPE SPORTS ANALYTICS MARKET FORECAST 2024-2032
-
NORTH AMERICA SPORTS ANALYTICS MARKET FORECAST 2024-2032